Getting started with project reports
Modified 1 year ago
Abhiram
Overview
The reporting module allows you to pivot data in a variety of ways, allowing you to gain real-time insights into your project, better predict and understand your business, and gain real-time visibility into performance and KPIs. It can be shared with internal and external stakeholders in your organization, and they can be restricted to specific users based on permissions.
Kissflow Project offers different system reports out-of-the-box. These include:
Task reports
Time reports
Flow reports
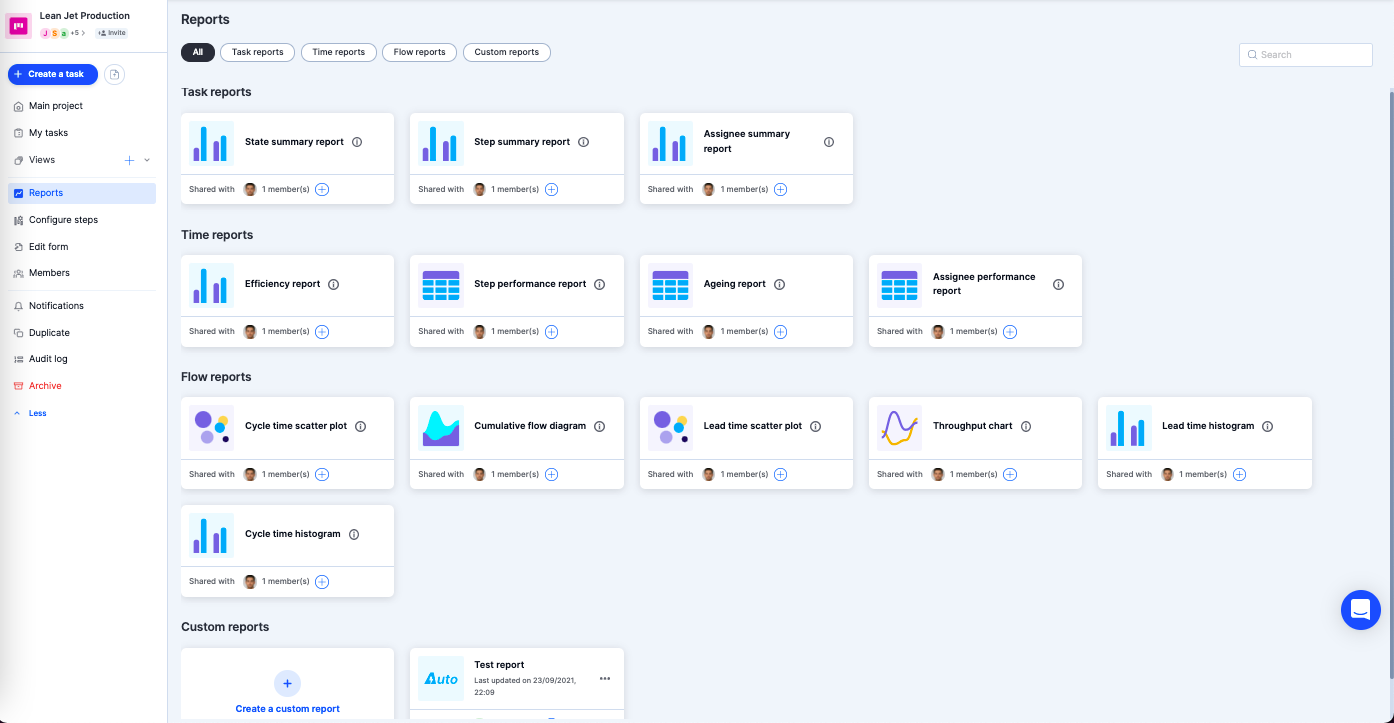
Custom reports
These reports can be built from scratch and are categorized as follows:
- Tabular reports display information in columns and rows.
- Charts display data graphically in one of ten chart types including area, bar, doughnut, line, pie, and bubble chart.
- Pivot tables can be used to quickly summarize large quantities of data. You can convert columns into rows and rows into columns.
Creating reports
Create your reports by clicking the Reports button on the left navigation bar of your project page. Reports are available by default to all Project Admins. Other members of the project can also access them if individual reports are shared with them.
Viewing reports
Use the Search box in the Report page to quickly find any report by name.