
 User guide
Creating Process Item completion time report with Analytics

Lead time, also known as the item completion time, is the time it takes for a work item to go from being created to being completed. It is an important measure of how efficient a business is. In the context of the approval process of an item, lead time is the amount of time it takes for the task to be completed from the moment it is created. It includes the time spent waiting for approvals, as well as the time spent reviewing and approving the item.
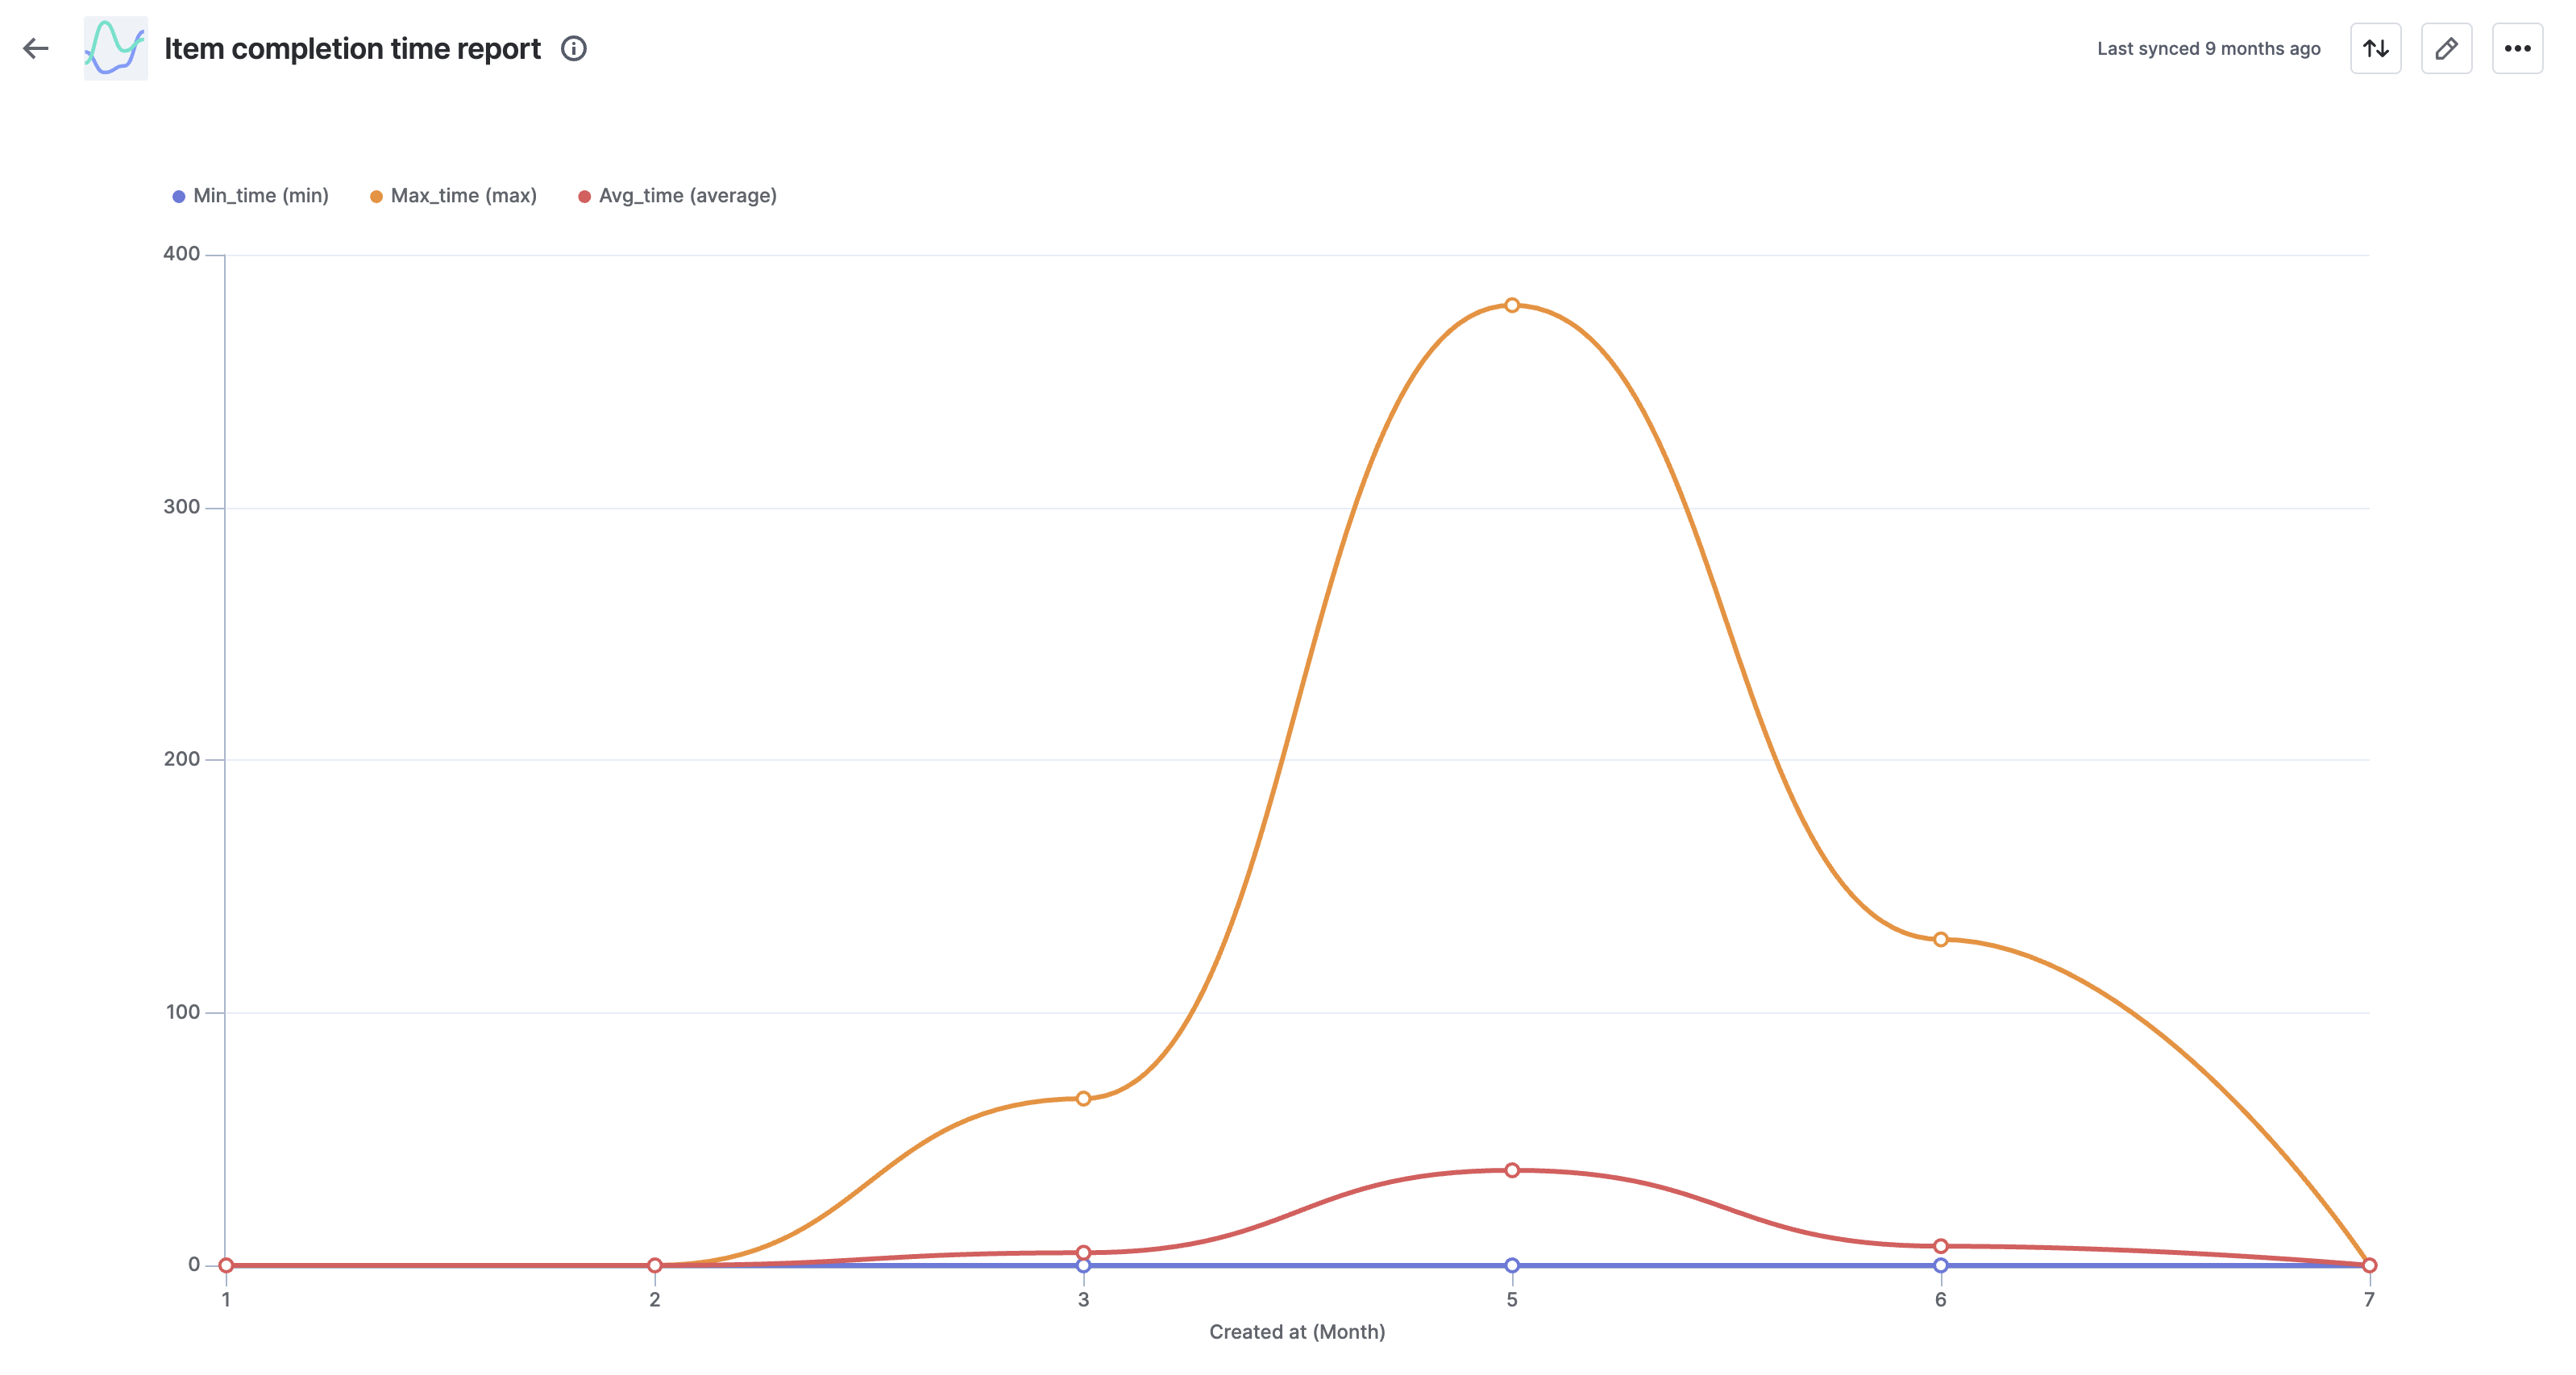
Item completion time report
The image above uses Kissflow Analytics to plot lead time of items created on a specific date. This report is similar to the Item completion time report available in the system metrics of process. Let’s explore how analytics can be used to customize this report.
Creating a dataview to track lead time
- Sign in to Kissflow and navigate to Analytics.
- Under the Data explorer tab, click Create Dataview. Learn about Using the dataview query editor.
Sample query
You can use the query editor in the Analytics platform to create a dataview. The provided SQL query can be pasted to the query editor to get this data.
SELECT
"_instance_id" AS "Item id",
"_flow_name" AS "Process name",
"_created_at.value" AS "Created at",
DATEDIFF(
'HOUR',
"_created_at.value",
"_modified_at.value"
) AS "LeadTime hours",
MIN("LeadTime hours") AS Min_time,
MAX("LeadTime hours") AS Max_time,
AVG("LeadTime hours") AS Avg_time
FROM
"ProcessInstance"
WHERE
"_status"='Completed'
GROUP BY
"Created at",
"_modified_at.value",
"Process name",
"Item id"
Query breakdown
The following table describes each part of the query.
Actual column name |
Alias name used in the query |
Description |
_instance_id |
Item id |
The unique ID of the item. |
_flow_name |
Process name |
The name of the process which the item belongs to. |
_created_at.value |
Created at |
The date and time when the item was initiated. |
_modified_at.value |
Modified at |
The date and time when the item was last modified. |
DATEDIFF( 'HOUR', "_created_at.value", "_modified_at.value" ) AS "LeadTime hours" |
LeadTime hours |
This is the column where lead time is calculated by finding the difference between item's creation time and last modified time when the item got a completed status. In this sample, it is calculated as HOUR which can be MINUTE / DAY. Check this for more assistance with this keyword. |
MIN (“LeadTime hours”) |
Min_time |
Returns the minimum value for the records within “LeadTime hours”, by date created. |
MAX (“LeadTime hours”) |
Max_time |
Returns the maximum value for the records within “LeadTime hours”, by date created. |
AVG (“LeadTime hours”) |
Avg_time |
Returns the average value for the records within “LeadTime hours”, by date created. |
Publishing the data in query editor
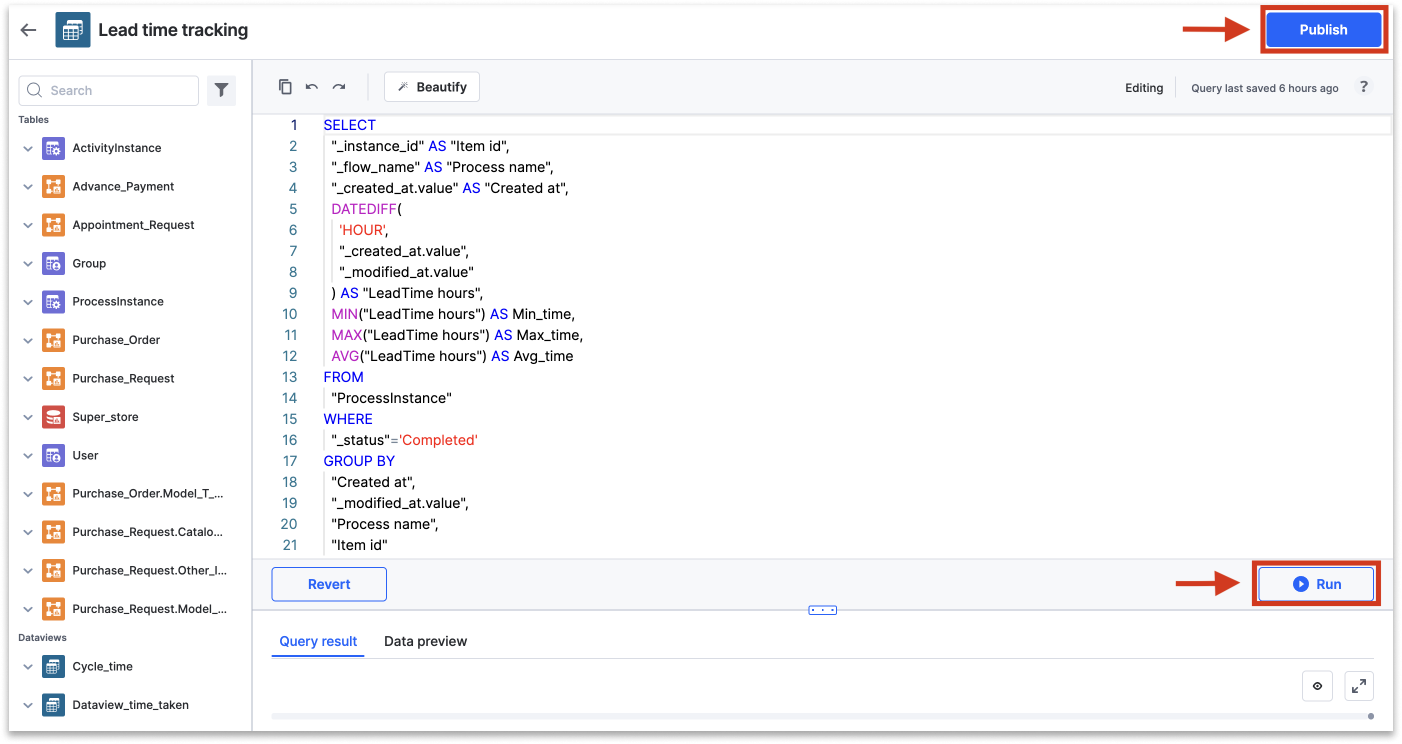
Once you have written the query, you can follow the below steps to publish the dataview.
- Run the query to get a view of the dataview.
- Click Publish once the query result is displayed.
Note:
In case of errors in the query, refer here.
Creating the lead time chart
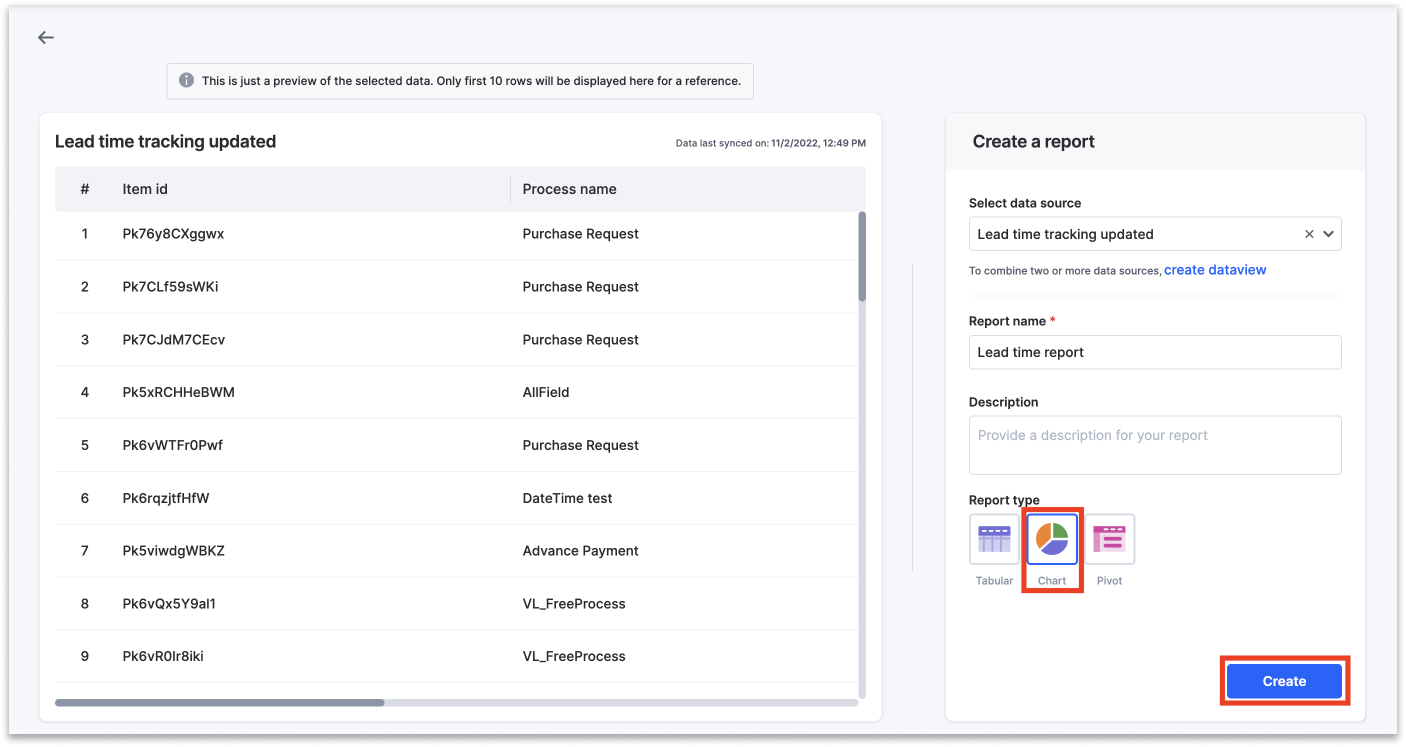
Using the above dataview as a data source, follow the steps below to create a report in Analytics.
- In Analytics, click the Reports tab > Create report button.
- Select the data source, which is the dataview you have created, from the dropdown menu.
- Provide any name for the lead time report like Item completion time report.
- Choose Chart report for data visualization.
- Click Create.
Configuring the chart
In the Configure report page, select the line chart and add the following:
- Add Created at (DATE) to the X-axis (Dimension). Change the YEAR which is set as the default option to DATE in the Dimension.
- Add Min_time, Max_time and Avg_time to the Y-axis (Measure).
- Select the data labels such as X-axis, Y-axis, Data labels and Legends for better visualization.
- Sort by Created at in ascending order.
- Click Save.
Filtering the chart
To get specific data from a chart report, you can filter the report by a specific process such as Purchase Request. For example, you could filter the report by the process named Purchase Request.
Viewing data
You can view more data in tooltip by moving your cursor over the data points in the report. You can also sort the report based on the dropdown menu such as Created at, Min_time, Max_time, Avg_time or None.
How are Analytics lead time report different from Process item completion time report?
Aspect |
Lead time report in Kissflow Analytics |
Item completion time report in Kissflow Process |
Report |
|
|
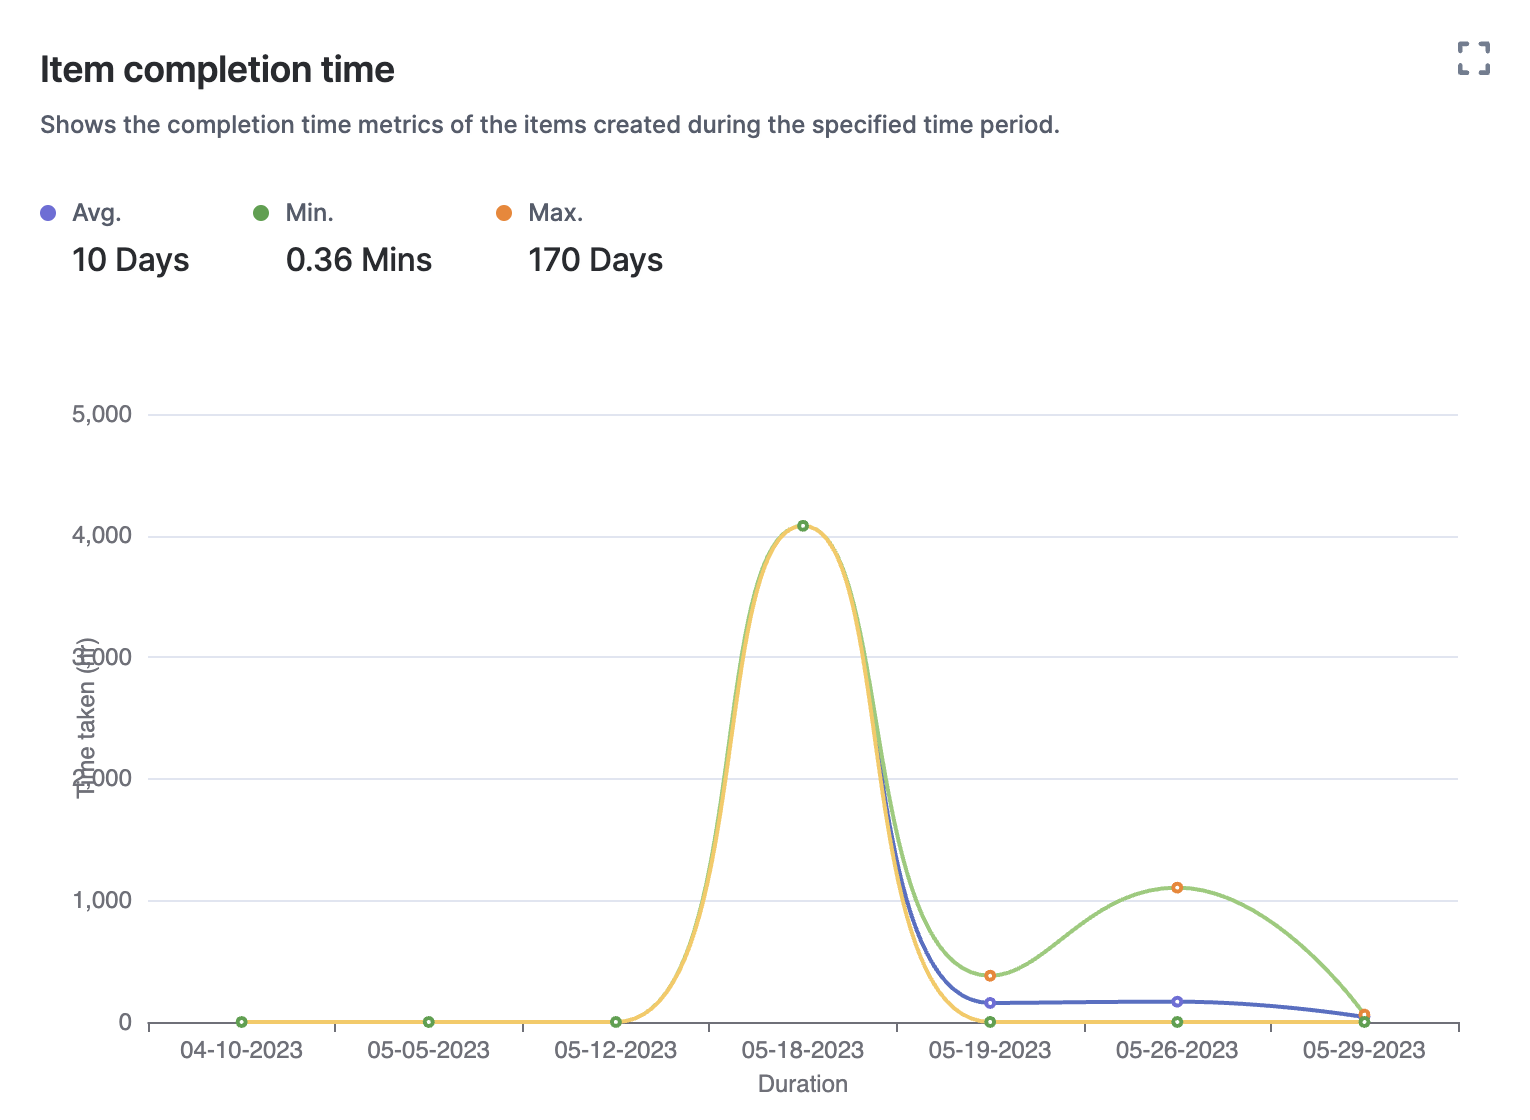
Overview |
Understand the time it takes for every work item to go from being created to being completed in a process or across multiple processes. |
Provides an overview of the minimum, maximum, and average time taken for items to be completed in a process during the specified time period. |
Accessibility |
Accessible through the Kissflow Analytics platform. |
Access this report within the Kissflow Process platform. |
Filtering |
Tailor made filter options are configured while creating the report. |
Filter by data range to see when items go from created to completed step. |
Scope |
Providing lead time insights across multiple processes. |
Provides insights into the time taken for items to be completed within a single process. |
Usage scenario |
Ideal for gaining insights into the item level efficiency and performance of work items across different processes. |
Useful for giving you aggregated information across items in a process. |
Data visualization options |
You can choose to visualize the data in charts, tabular and pivot tables. |
You get to view the data in tabular form in the Process item completion time report. |
Both item completion time reports in Kissflow Process and Lead time reports in Analytics provide valuable insights into process efficiency and completion timelines. While the Process report focuses on individual processes, the Analytics report allows you to assess lead time across multiple processes. Choose the most suitable report based on your specific analysis needs and process optimization goals.