Reports overview
Modified 9 months ago
Mekha Mathew
Kissflow Work Platform:
- Small Business
- Corporate
- Enterprise
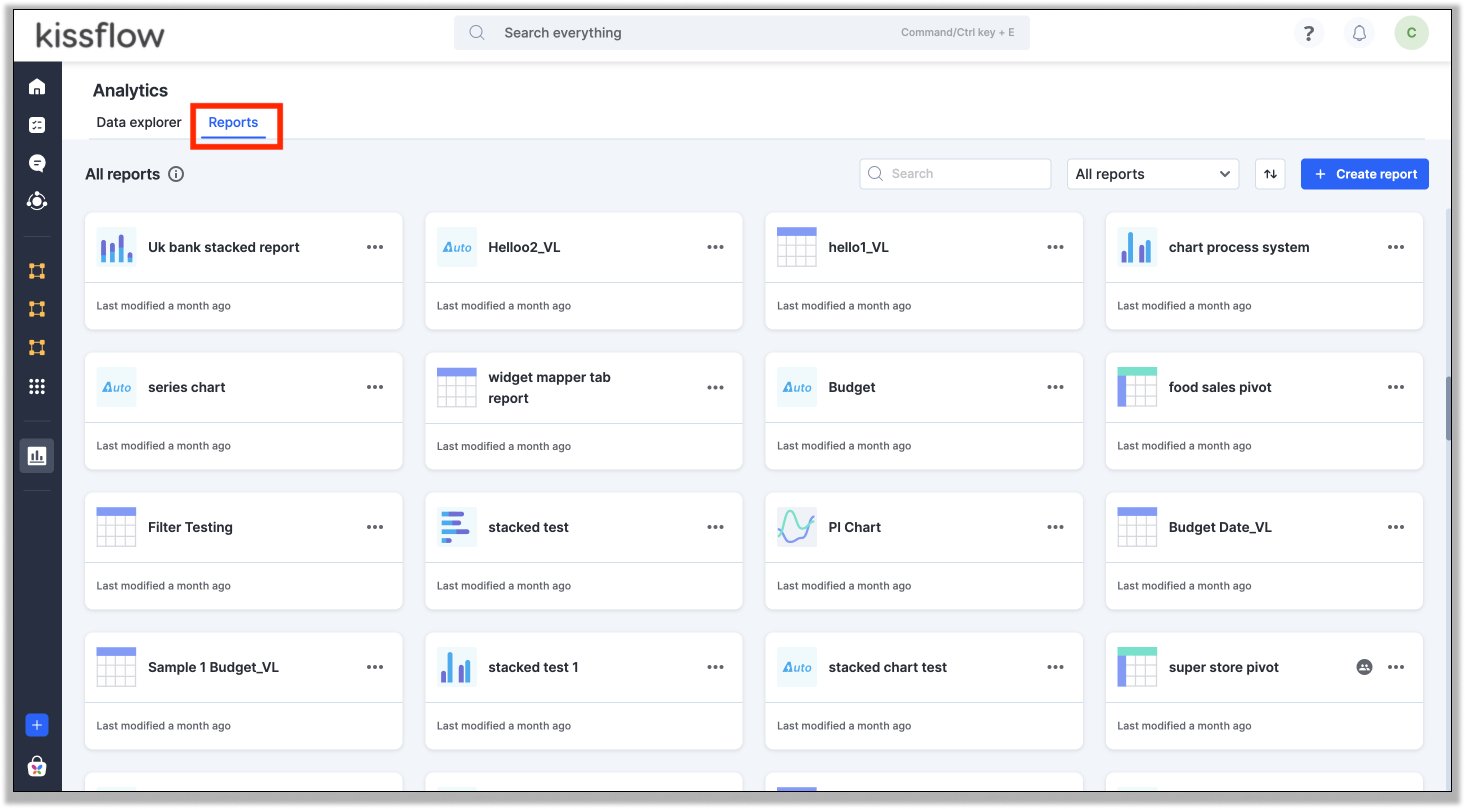
Kissflow Analytics Reports is a powerful tool that helps you create cross-form reports by combining various data sources, including process tables, child tables, system tables, datasets, and dataviews, and turn them into useful information. Analytics is highly customizable, wherein you can combine any dataset to create a meaningful report using SQL commands and simplify the report into data-rich charts and tables. Through these custom reports, Analytics helps you analyze metrics and interpret significant patterns in data and enables you to make data-driven decisions.
Types of reports
There are three different types of reports in Analytics.
- Tabular report: Displays your data in rows and columns, forming a grid similar to a spreadsheet.
- Chart report: Displays data graphically in one of the ten chart types, including area, bar, doughnut, line, pie, and scatter chart.
- Pivot tables or Pivot report: Quickly summarizes large quantities of data. You can convert columns into rows and rows into columns.
What can you do with reports in Kissflow Analytics?
- Use dataviews to combine data from multiple Kissflow forms that provide insights about the data you want to visualize.
- Customize your report by adding filters and using the sort options to suit your requirements.
- Create various chart types, including pie charts, bar charts, and line charts.
- Share reports by setting various permission levels to control who has access to the data.
- Export your reports in different formats, such as CSV or JSON, making it easier to share with other stakeholders.