
 User guide
Creating Process Step performance report with Analytics

Time is a critical factor when it comes to creating a process workflow. Setting SLAs and deadlines relies on estimating the time needed for each workflow step based on complexity and available resources. Let's explore how to create a Step performance report in Kissflow Analytics to analyze the time each process item spends in each workflow step.
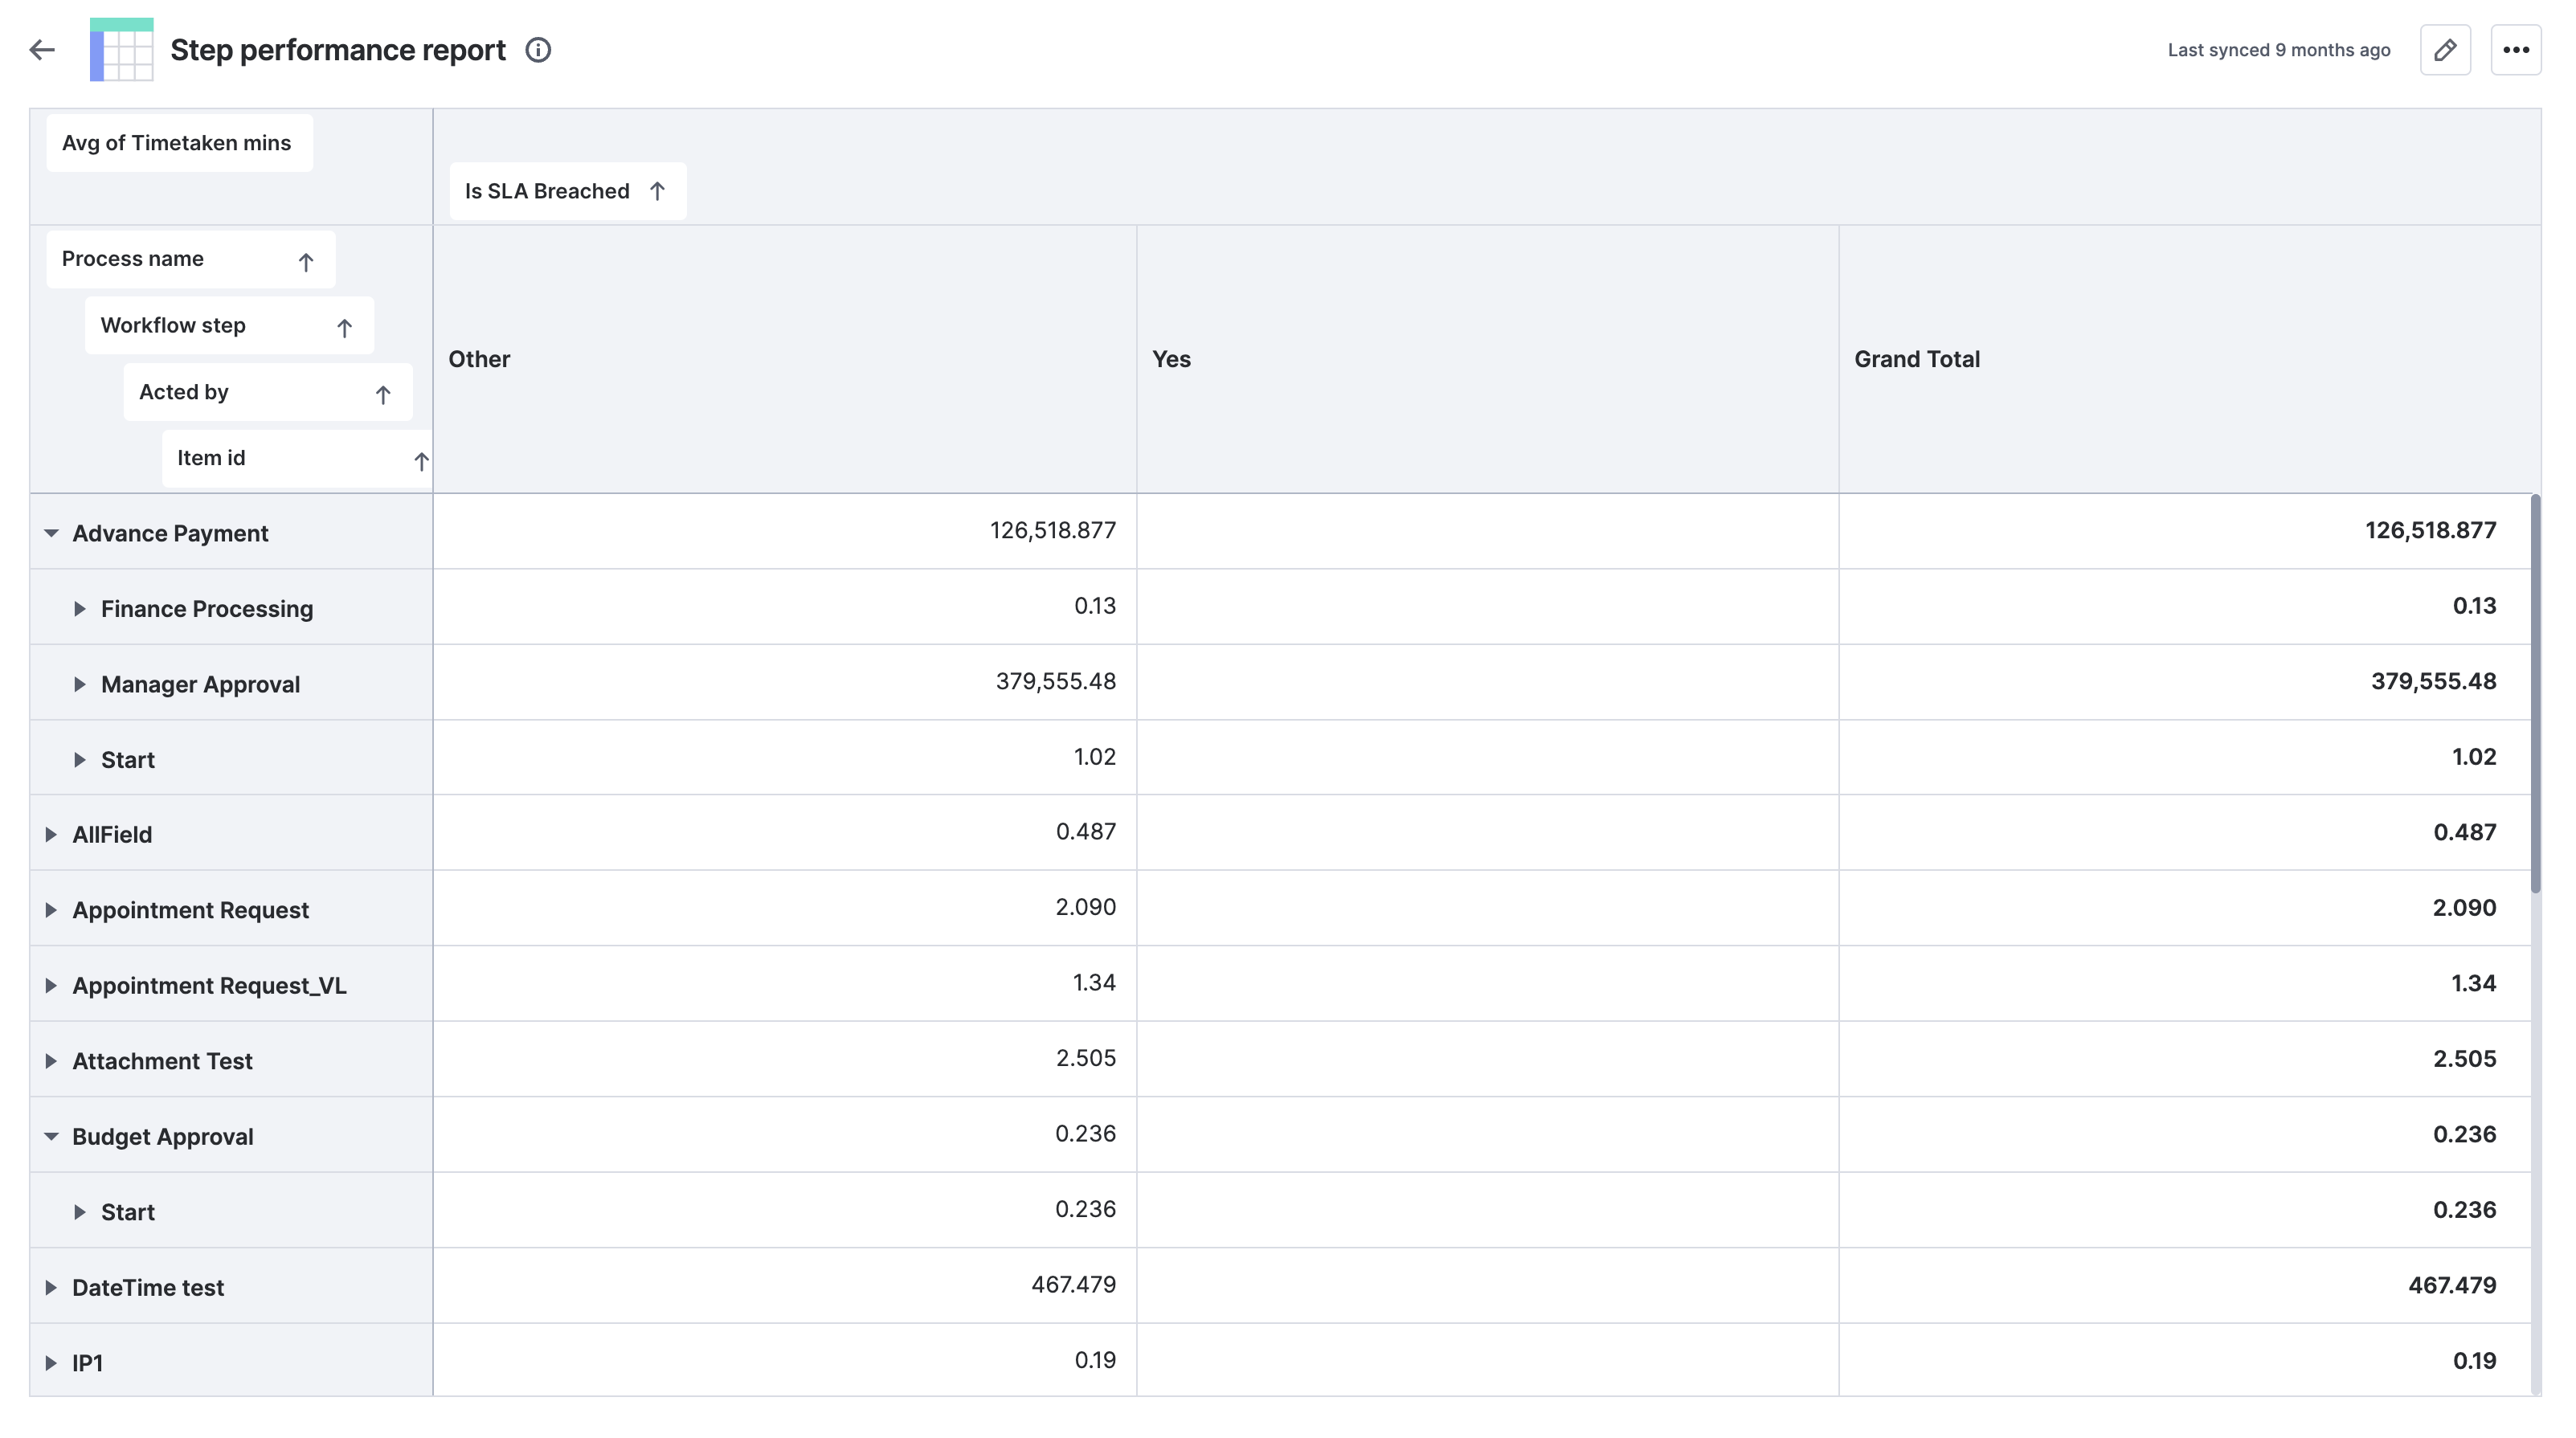
Step performance report
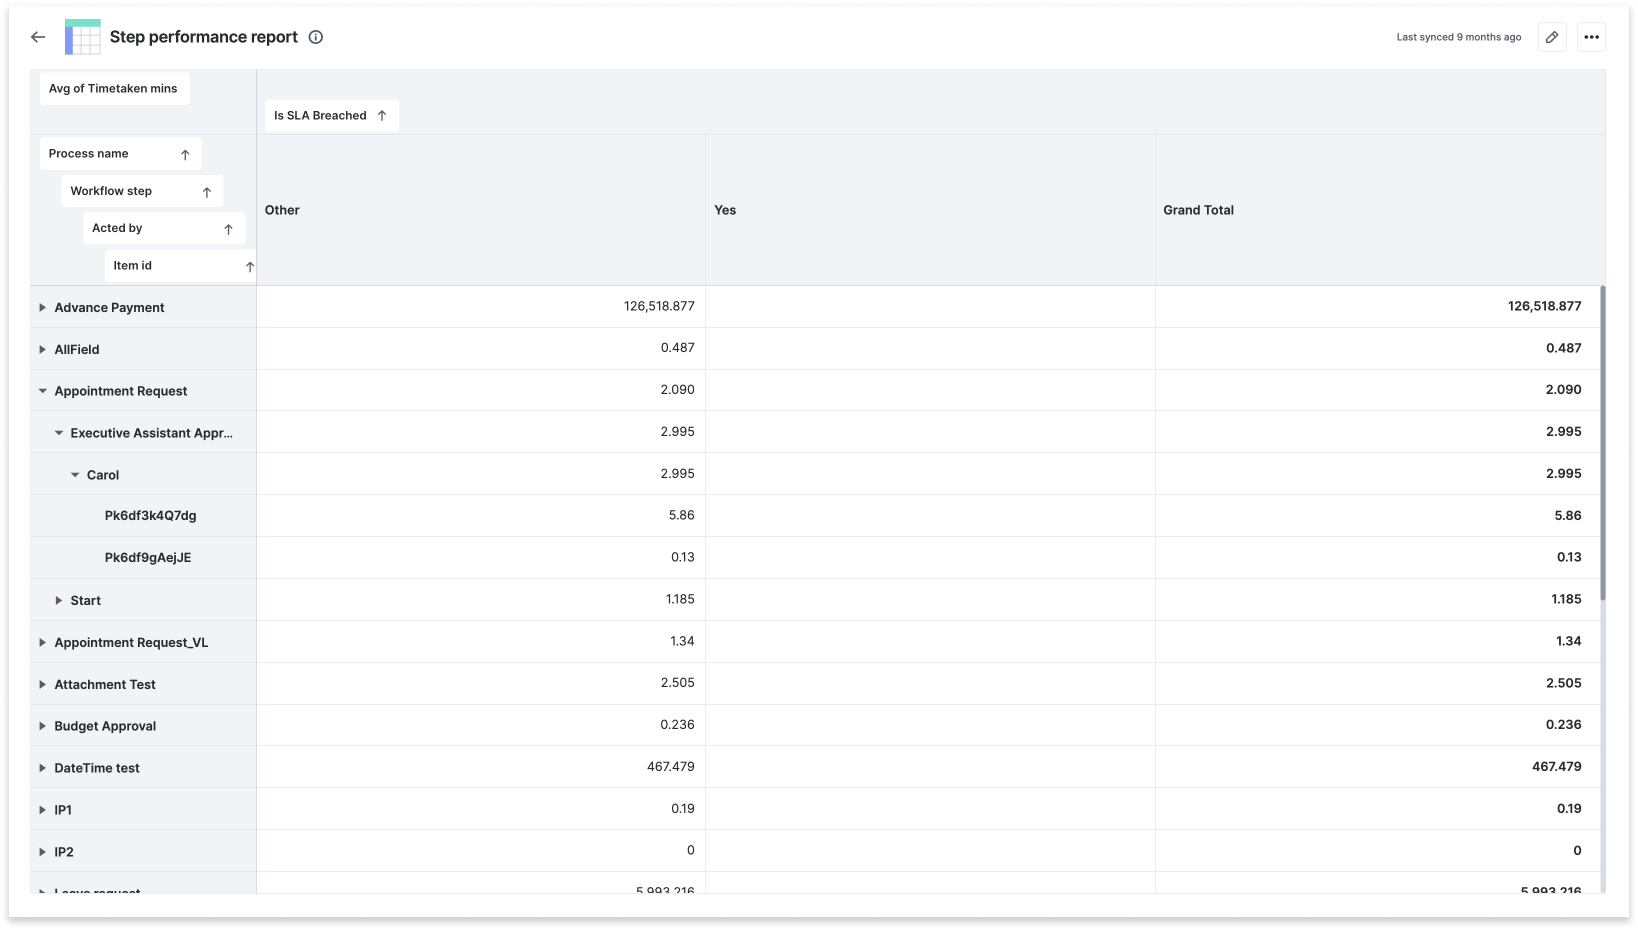
The image above displays the stepwise time taken for each item using Kissflow Analytics. This report is similar to the Step performance report available in the process system reports. Let's see how you can customize this report using Analytics.
Creating a dataview to track step performance
- Sign in to Kissflow and navigate to Analytics.
- Under the Data explorer tab, click Create Dataview. Learn about Using the dataview query editor.
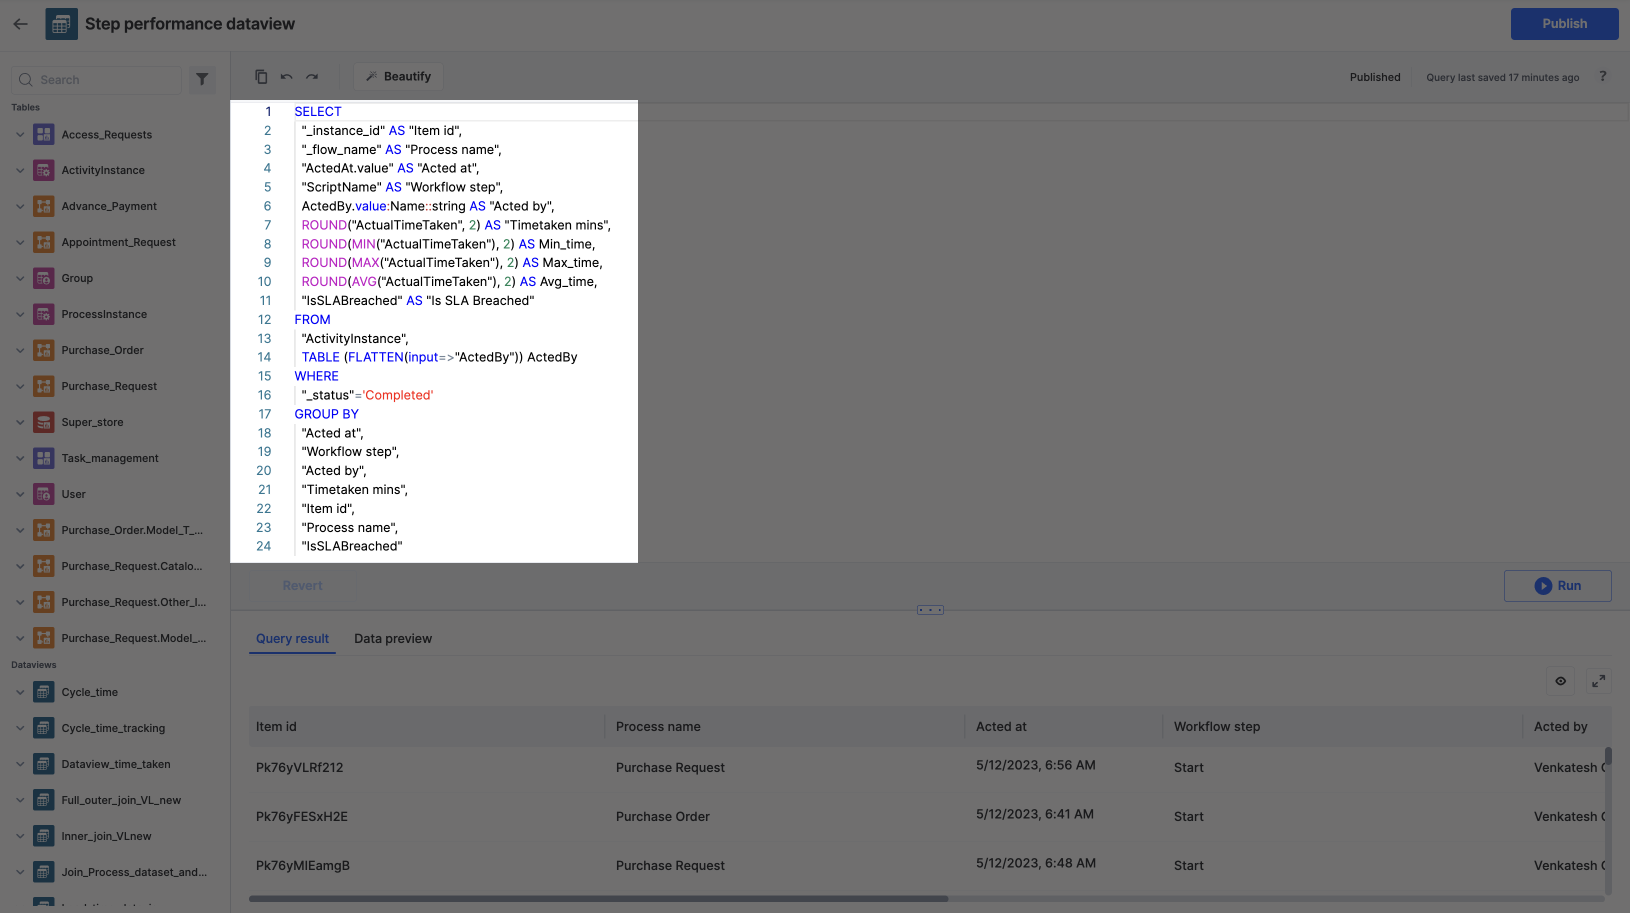
Sample query
You can create a dataview using the Analytics query editor. Copy and paste the provided SQL query to get the desired data. This query retrieves approved items, i.e., those marked as Completed. It does not include Sentback, Rejected, InProgress, and Withdrawn items.
SELECT
"_instance_id" AS "Item id",
"_flow_name" AS "Process name",
"ActedAt.value" AS "Acted at",
"ScriptName" AS "Workflow step",
ActedBy.value:Name::string AS "Acted by",
ROUND("ActualTimeTaken", 2) AS "Timetaken mins",
ROUND(MIN("ActualTimeTaken"),2) AS Min_time,
ROUND(MAX("ActualTimeTaken"),2) AS Max_time,
ROUND(AVG("ActualTimeTaken"),2) AS Avg_time,
"IsSLABreached" AS "Is SLA Breached"
FROM
"ActivityInstance",
TABLE (FLATTEN(input=>"ActedBy", outer => true)) ActedBy
WHERE
"_status"='Completed'
GROUP BY
"Acted at",
"Workflow step",
"Acted by",
"Timetaken mins",
"Item id",
"Process name",
"IsSLABreached"
Query breakdown
The following table describes each part of the query. Along with the table name ActivityInstance, FLATTEN command is used here to parse ActedBy which is a JSON array and outer=> true provides the list of all ActedBy including skipped steps like completed in a process. This command returns one row for each element in the array.
Actual column name |
Alias name used in the query |
Description |
_instance_id |
Item id |
The unique ID of the item. |
_flow_name |
Process name |
The name of the process which the item belongs to. |
ActedAt.value |
Acted at |
The date and time when the process step was approved. |
ScriptName |
Workflow step |
The name of the process step. |
ActedBy.value:Name::string |
Acted by |
The name of the user who approved the process step. |
IsSLABreached |
Is SLA Breached |
If the particular step has breached SLA, it will be marked as true. |
ROUND("ActualTimeTaken", 2) |
CycleTime mins |
The query part ROUND("ActualTimeTaken",2) AS "CycleTime mins" is used to calculate the cycle time in mins for each item. The ActualTimeTaken column contains the time in minutes it took for each item to be completed. |
ROUND(MIN("ActualTimeTaken"),2) |
Min_time |
Returns the round minimum value of the ActualTimeTaken column to two decimal places. |
ROUND(MAX("ActualTimeTaken"),2) |
Max_time |
Returns the round maximum value of the ActualTimeTaken column to two decimal places. |
ROUND(AVG("ActualTimeTaken"),2) |
Avg_time |
Returns the round average value of the ActualTimeTaken column to two decimal places. |
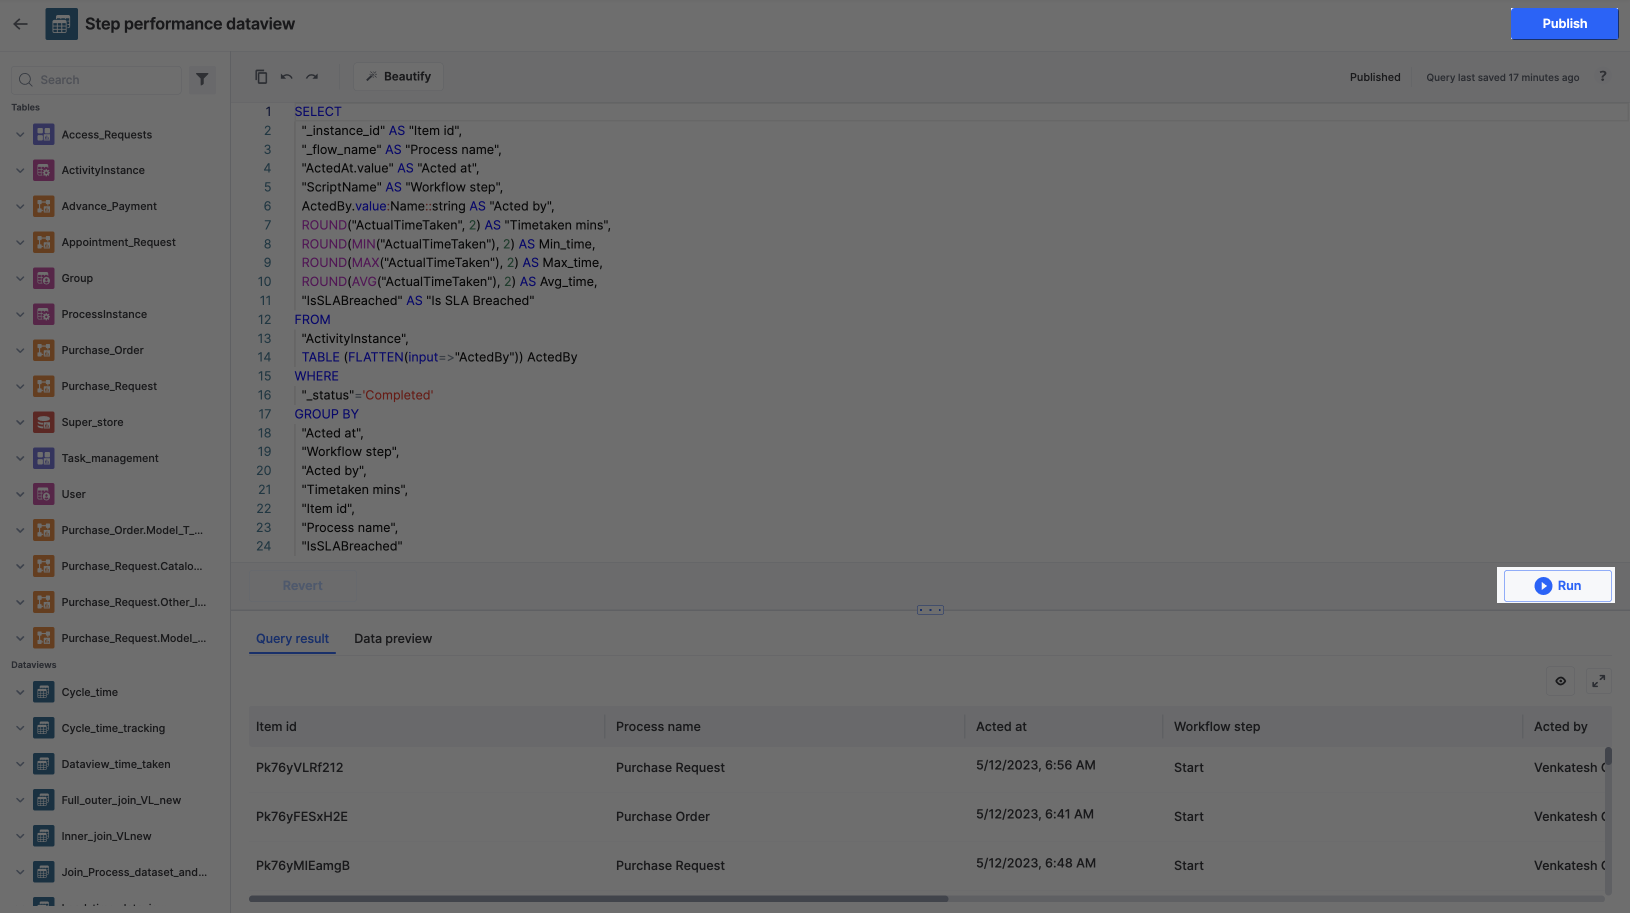
Publishing the data in query editor
After writing the query:
- Run the query to preview the dataview.
- Click Publish once the query results are displayed.
Note:
If you encounter any error, refer to Analytics FAQs for solutions.
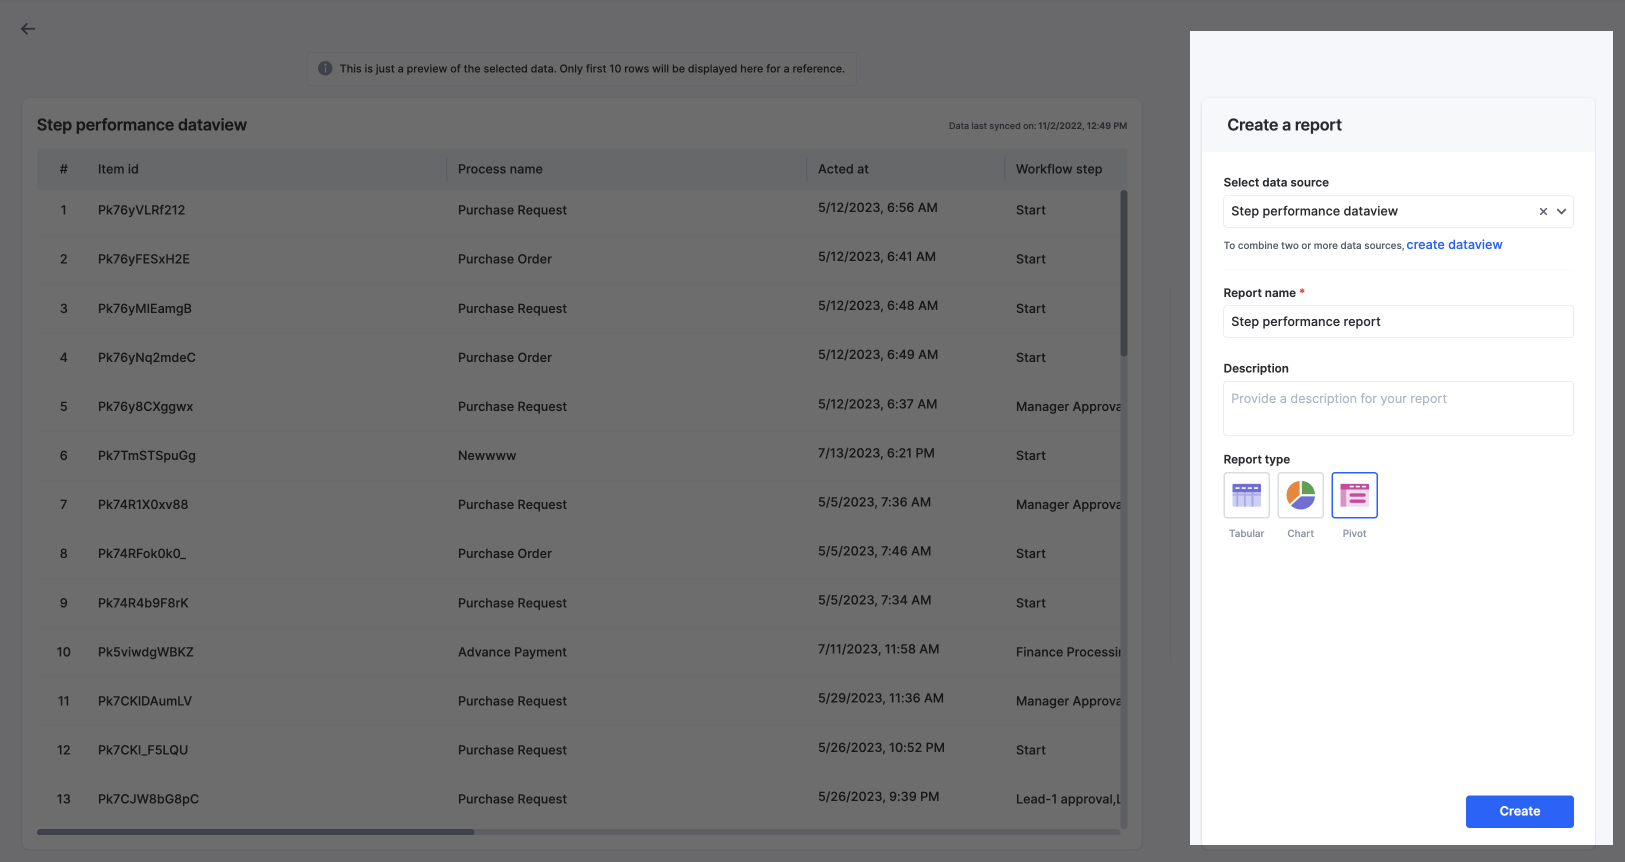
Creating the step performance report
To create a report using the dataview as a data source, follow these steps:
- In Analytics, click the Reports tab and click Create report.
- Choose the previously created dataview from the dropdown menu.
- Give the report a name, such as Step performance report.
- Select Pivot report or Tabular for data visualization and click Create.
Configuring pivot table
- For a detailed report, configure the report page by adding the following.
- Values: Time Taken mins
- Rows: Process name, Workflow step, Item id, and Acted by
- Columns: Is SLA Breached
- Grand Totals: Show grand totals for columns only
- Value Calculations: Keep as is
- Filter the report by applying the condition Acted at Is not empty.
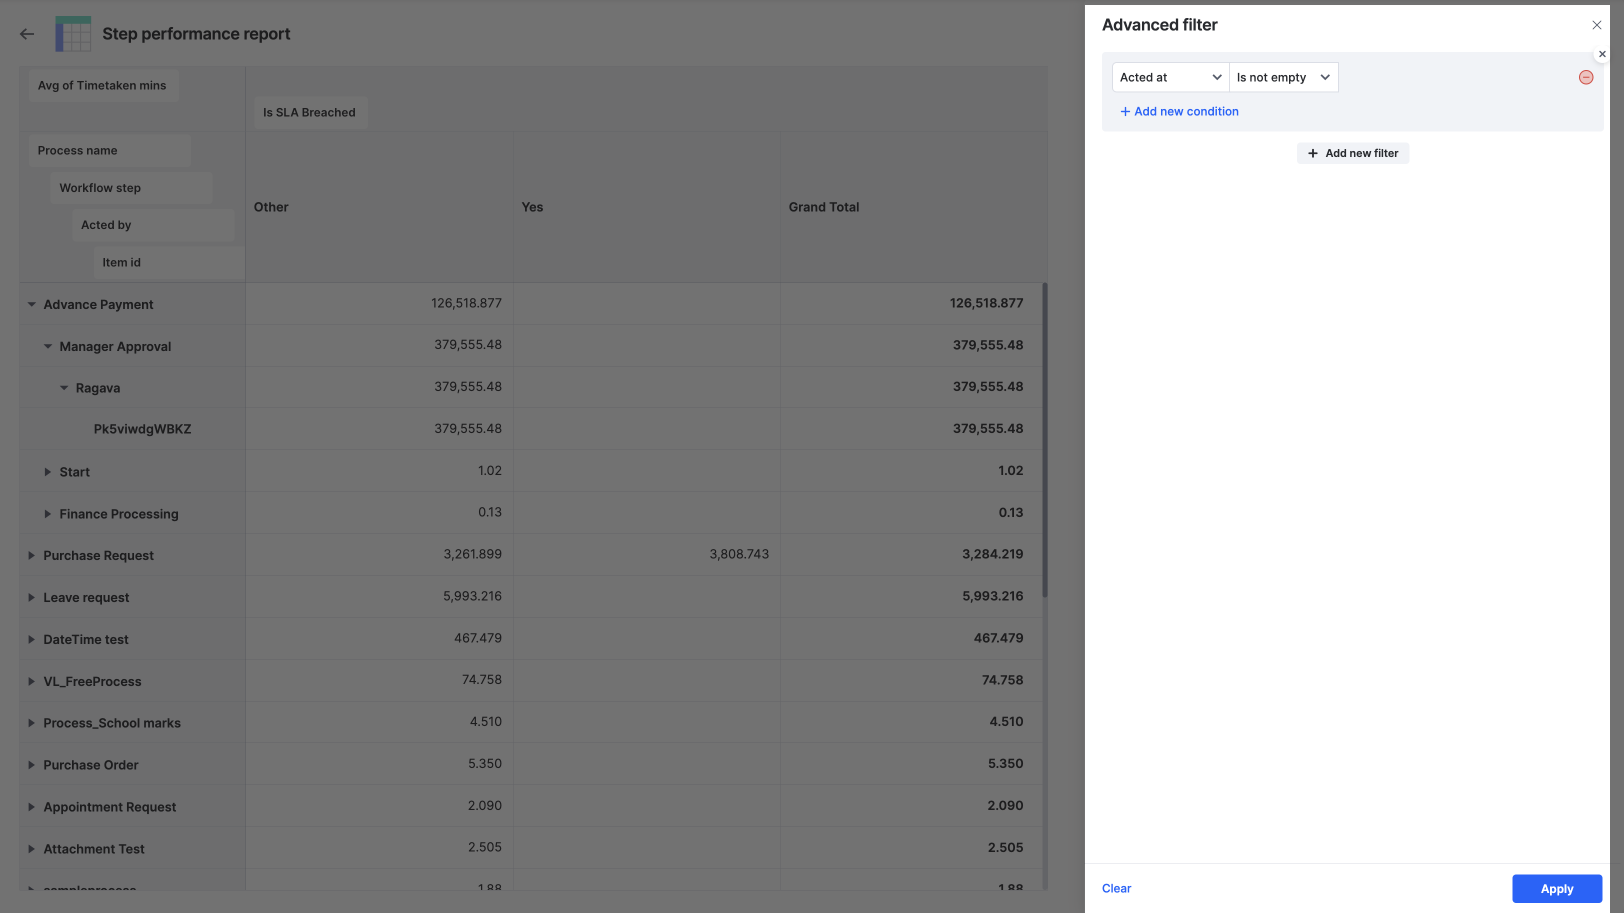
- Click Apply and Save the report to view it.
Illustration of row representation
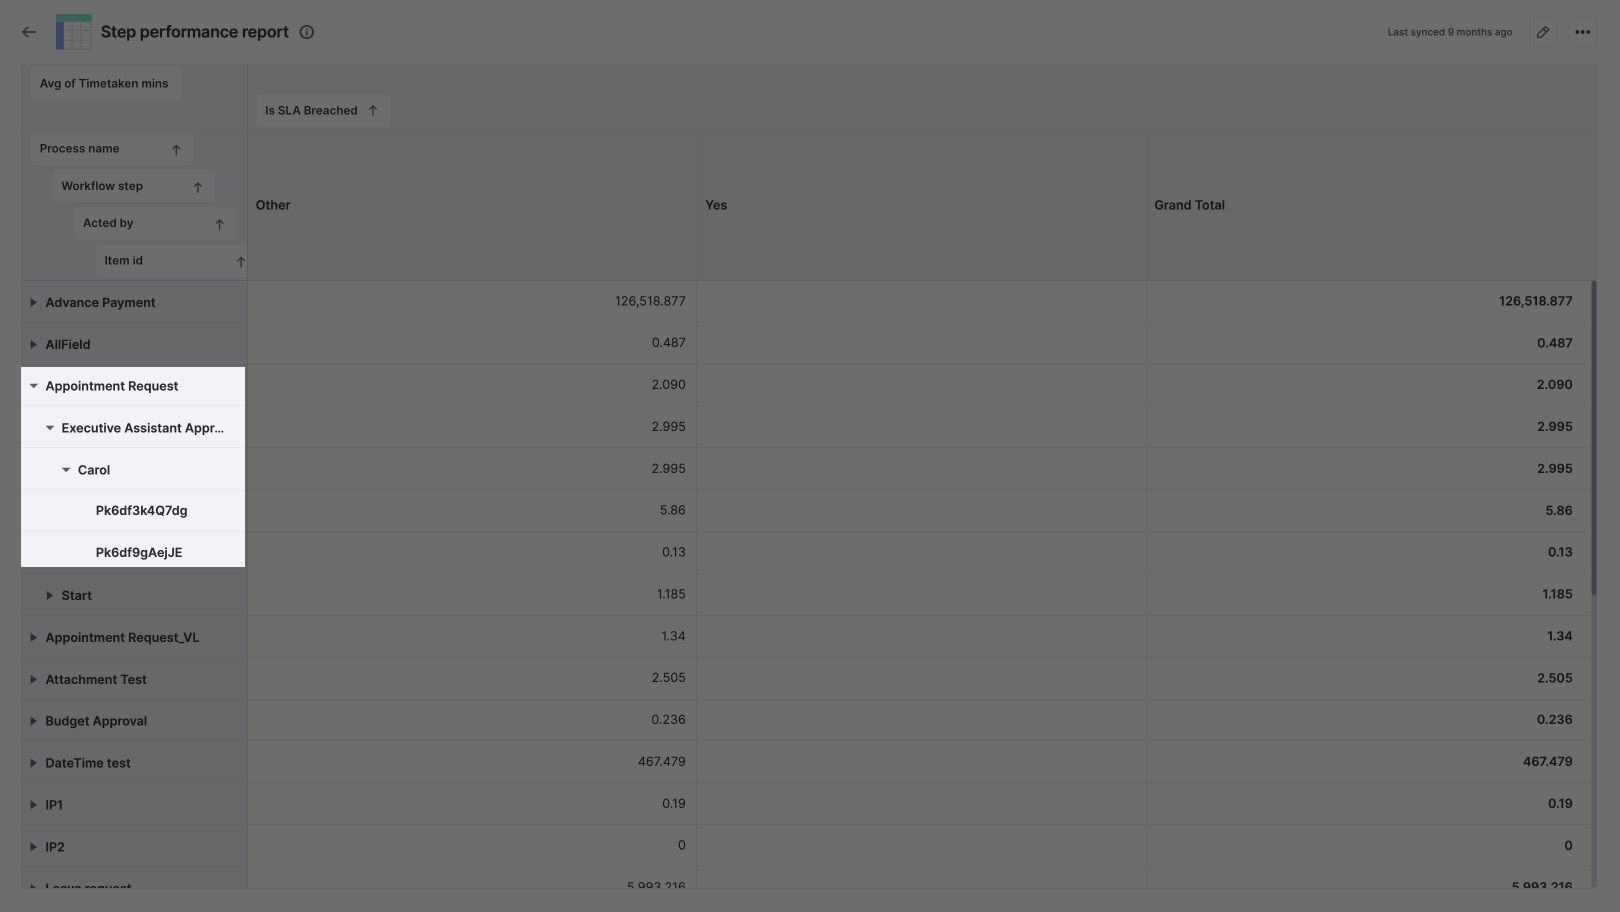
In the provided image, the details are as follows:
- Process Name: Appointment Request
- Workflow Step: Executive Assistant Approval
- Acted By: Carol
- Item ID: Unique identifier for the items
The Is SLA Breached field has two values:
- Yes represents the average time for items that have breached the SLA.
- Other represents the average time for items that were completed before the SLA breach deadline.
Configuring tabular report
To create a tabular report with stepwise time for each item in the process, follow these steps.
- In the Configure report page, add the following columns:
Workflow step
Acted by
Timetaken mins
Min_time
Max_time
Avg_time
Acted at (Date)
Item id
Process name
Is SLA Breached - Sort the report by Acted at in descending order and click Save.
Filtering the report
You can filter the report to show specific data by process or workflow step. For example, you can filter the report only to show data for the Purchase Request process and the Manager Approval workflow step.
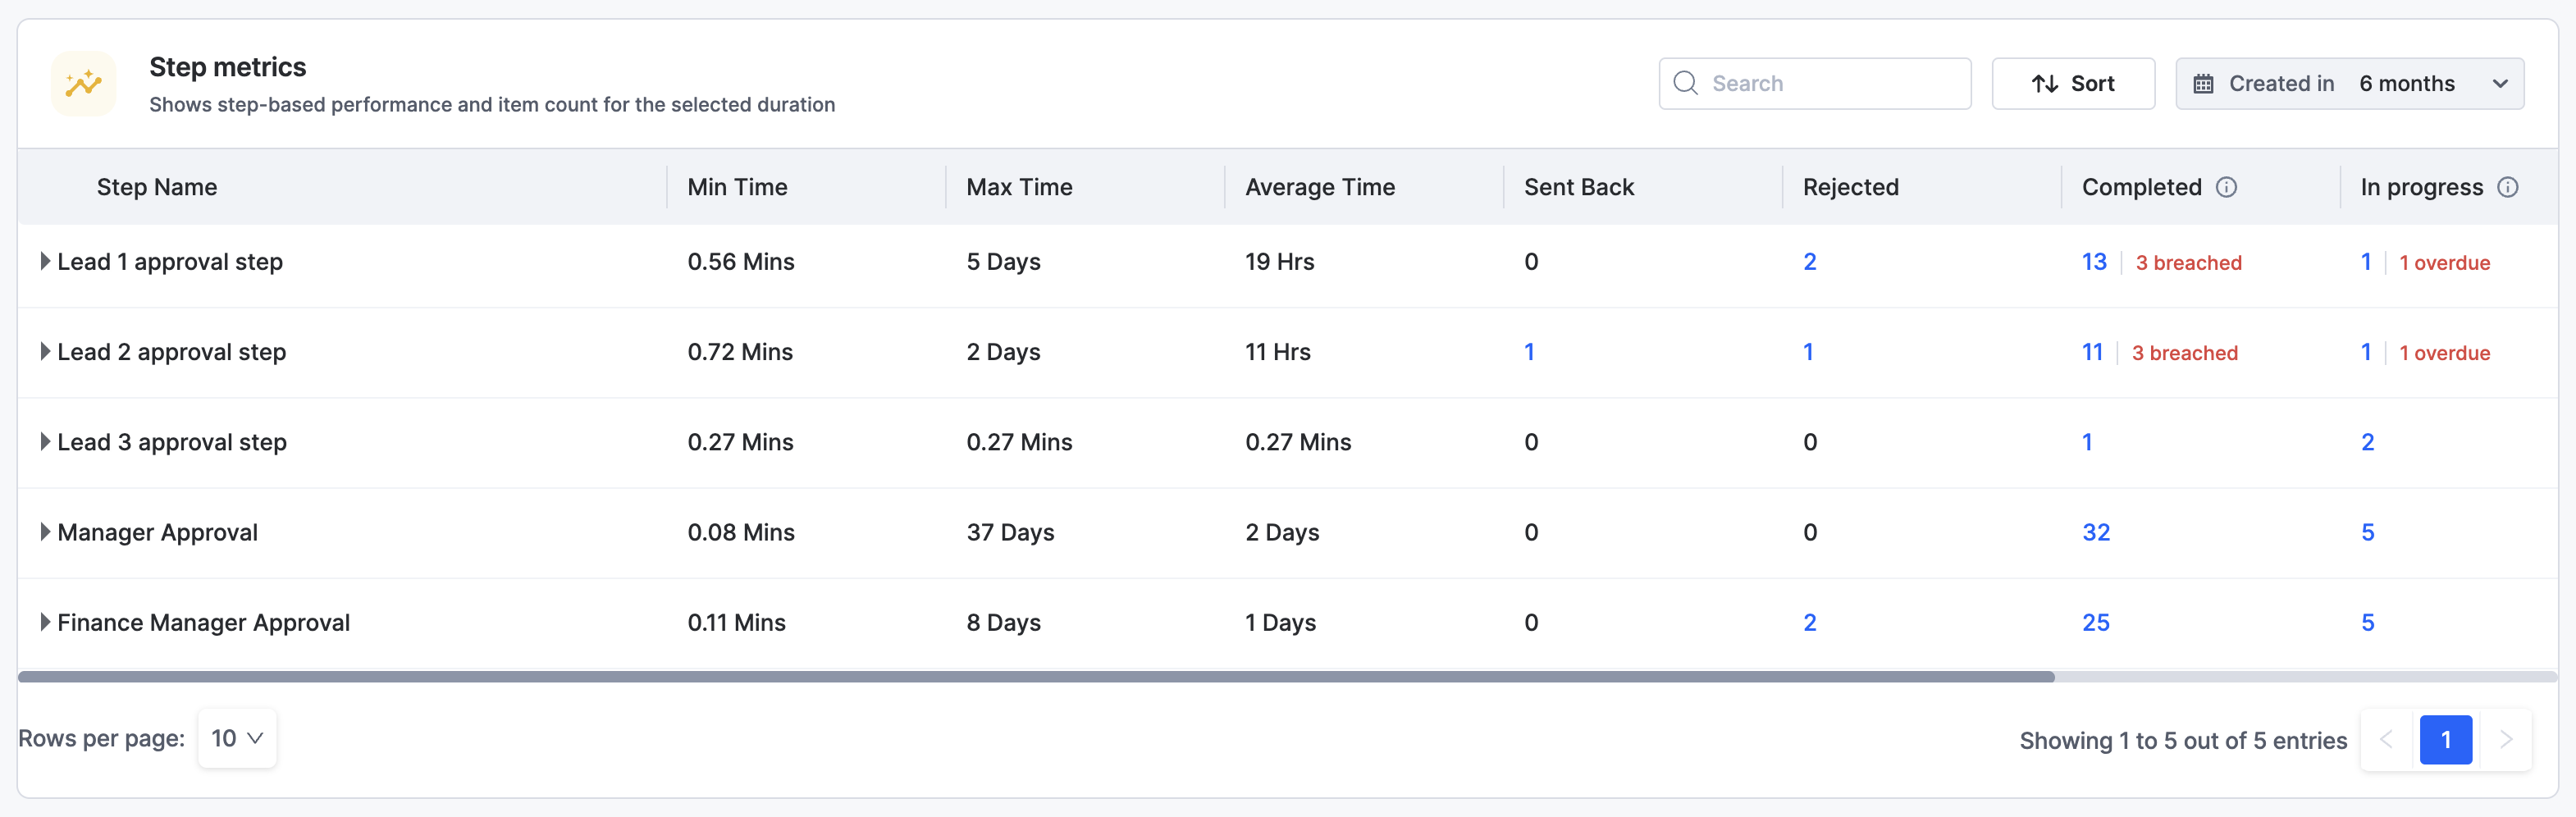
How are Analytics step performance report different from Process Step metrics report?
Aspect |
Step performance report in Kissflow Analytics |
Step metrics report in Kissflow Process |
Report |
|
|
Overview |
Offers a detailed breakdown of step-wise time taken for each step by each user. Additionally, you can view item-wise time taken for each step. |
Provides an overview of the minimum, maximum, and average time taken for each step by users in a process. |
Filtering |
Tailor made filter options are configured while creating the report, allowing you to view step performance reports for a particular step in a process or across multiple processes. |
Filter by data range to see when items get created. This report provides insights for a specific process. |
Scope |
Provides more granular insights at the step and item levels, allowing you to dive deeper into the performance of multiple processes. |
Focuses on providing you with process-level aggregated insights across steps and users. |
SLA Breach Identification |
Enables you to easily identify the number of items that have breached SLAs in the processes. |
Does not directly identify SLA breaches. |
Usage scenario |
Suitable for in-depth analysis, especially when you need to understand the performance of specific steps or identify patterns across multiple processes. |
Ideal for giving you a quick overview of process performance. |
Accessibility |
Accessible through the Kissflow Analytics platform. |
Accessible within the Process’ Reports. |
Data visualization options |
Provides a wide range of data visualization options, including tabular report, different types of charts, and pivot tables. |
Table visualizations are auto-generated and read-only. |
Both Step metrics reports in Kissflow Process and Step performance reports in Analytics offer valuable insights into process performance. While the Step metrics reports give you a quick overview, the Step performance reports in Analytics offer deeper analysis. Depending on your specific needs, you can choose the most suitable report type to gain the necessary insights.