Pivot reports
Modified 11 months ago
Mekha Mathew
Kissflow Work Platform:
- Small Business
- Corporate
- Enterprise
Pivot tables or reports enable you to condense and analyze data effectively.
Creating a pivot table
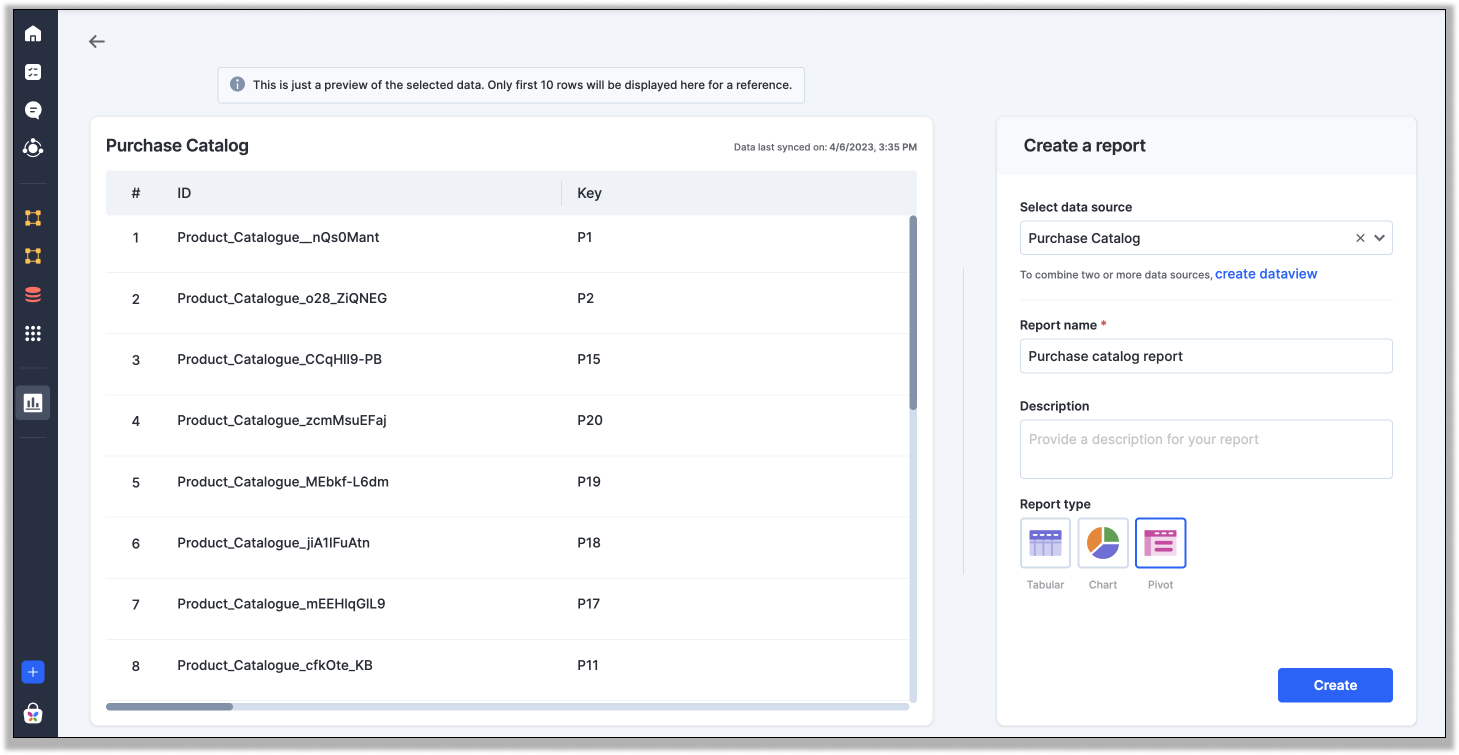
- To create a pivot report, click the Reports tab on the Analytics page.
- Provide a name and description for the report.
- Choose the type of report as Pivot and click Create.
Configuring a pivot table
If you want to create a purchase catalog report in which you can compare the totals for each row, then pivot report is the right choice. The report gives you a quick overview of the data by displaying grand totals depending on the specific needs of the user. Eg: A sales manager can use a pivot report to analyze sales data by product category, customer, or sales representative. The manager can use the grand totals to see the total number of customers in each age group, location, or product purchased.
Additionally, adding filters and grand totals enables you to narrow down the data, making it easier to analyze and draw insights.
You can select the fields displayed as columns and rows in the Configure report section under Settings. To remove fields, you can click the Delete button ( ).
).
Settings
Columns: Add fields as columns from the data source. The order of selection determines the hierarchy of columns. Subtotal columns are automatically generated for consecutive levels with Total appended to the column name.
Values: Hovering over a value reveals its corresponding row and column. Select a field for aggregated values in the pivot table under Values. Choose from aggregation types such as sum, avg, count, min, max, or variance.
Rows: Add fields as rows from the data source. The order of selection determines the hierarchy of rows. Successive rows are placed under the initial row based on the field order.
Adding filters
Adding a Filter is similar to that of tabular reports. Click the Add advanced filter button to add a filter. Choose the fields you want to use based on your filter and enter the conditions. Click Save to configure the report.
Grand totals and Value calculations
Select how you want to display grand totals from the dropdown menu located under Grand totals.
- Show grand totals - display grand totals for all rows and columns.
- Show grand totals for columns only - display grand totals for each column.
- Show grand totals for rows only - display grand totals for each row.
- Do not show grand totals - hide grand totals for all rows and columns.
From the dropdown menu located under Value calculations, select how you want to calculate values.
- Keep as is - don't change the values.
- Percent of grand total - the table values will be displayed in percentage instead of sum.
- Percent of row - the row total will be shown in percentage instead of sum.
- Percent of columns - the column total will be displayed in percentage instead of sum.
Other actions
When viewing a pivot table, you can collapse, expand, and use the Sort button ( ) to sort the columns and rows. You can sort the data based on the field in ascending or descending order by clicking the field. The default sort is in ascending order.