
 User guide
Board metrics in apps

There are two board metric reports that you can use in apps. They are:
- Aging report
- Status performance report
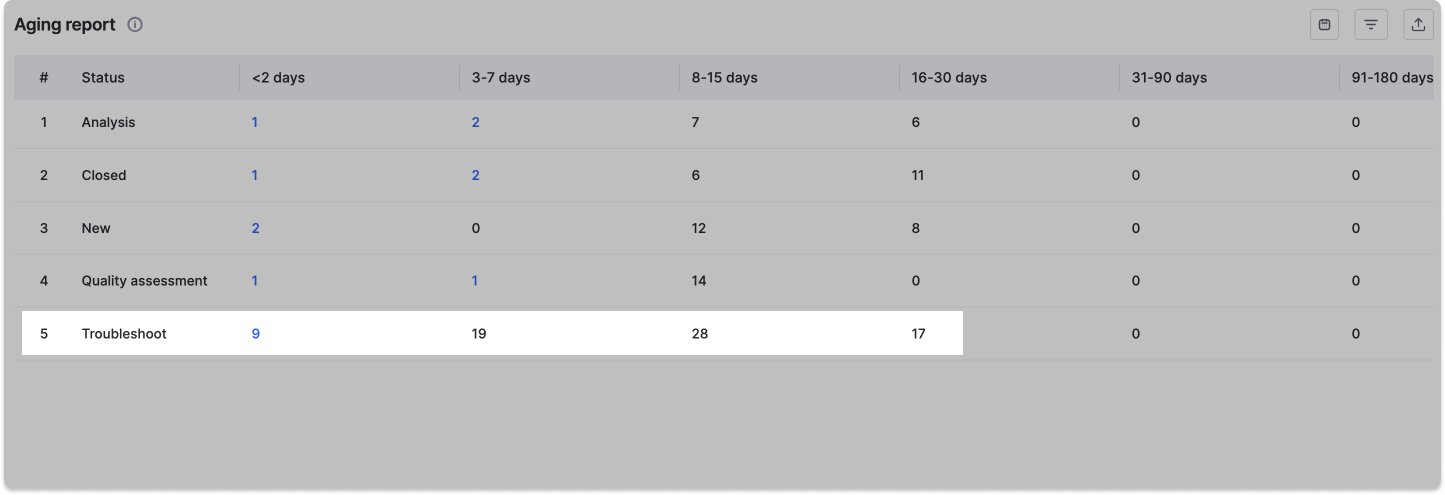
Aging report
The Aging report helps you track your current work in progress and identify items that have been overdue for an extended period of time. It essentially tells you how many items were held in each status and for how long.
To add this report to a page, click Board components button (![]() ) in the left panel, select Aging, and drag it to the desired location in the page.
) in the left panel, select Aging, and drag it to the desired location in the page.
You can set the Created within time and apply filters to the report in addition to exporting it as a CSV file.

To view the list of board items, click the numbers in the report. From here, you can open items, reassign them, change their statuses and priorities, and delete them.
Understanding the aging report
Items in your board spend varying amounts of time in each status. It is critical to understand where your board is stalling in order to determine why and how to improve it.
You can easily understand how your team performed in similar situations in the past using the work in progress aging data. These statistics could be used to create new strategic goals for your board.
Let's look at an example to see how the aging report can be used.
What are the statuses that have been slowing down my board for the past three months?
To obtain this information, select Created within time as This quarter. According to the report, the status that has the most overdue items for an extended time during this period is the one that is slowing down the board.
For best completion rates, the age of the items in progress must be kept as low as possible. If items are in the same status longer than expected, further investigation and action may be required.
Status performance report
The status performance report displays all descriptive statistics about the distribution of time ranges in the data. This report provides the minimum, maximum, mean, and median time spent by items for each status and assignee combination.
To add this report to a page, click Board components button (![]() ) in the left panel, select Status performance, and drag it to the desired location in the page.
) in the left panel, select Status performance, and drag it to the desired location in the page.

You can set the Created within time and apply filters to the report in addition to exporting it as a CSV file.
You can use this report to isolate statuses where items take up more time than others and identify performance ranges in your board. You can further break down each status by users of your team.
Minimum time: The least time spent by items in a specific status or with a user.
Maximum time: The maximum time spent by items in a specific status or with a user.
Mean time: The average time spent by items in a particular status or with a user. It is calculated by adding up the individual time values and dividing the result by the number of items in these statuses or with these users. It is also known as the arithmetic mean.
Median time: This is preferred over mean time when you have outliers in your data ranges. Just like the mean time, the median also represents the location of a set of numerical data points by means of a single number. Roughly speaking, the median is the value that splits the data points into two halves: the (approximately) 50% largest and 50% lowest data in the collective when arranged in ascending order.