Creating user workload report for processes
Modified 9 months ago
Mekha Mathew
In a user workload report, you can view all the process items which are assigned to users. As an account admin, the user workload report helps track items assigned to different users in your account, identifies the number of pending items, and helps examine the overall workload of users.
To create a user workload report of processes for all users in your account, you will need to use one of the following methods:
- Create a tabular report using the ProcessInstance table as the data source.
- Create a dataview and use it as a data source to build a chart or pivot report on top of it.
Using ProcessInstance as a data source
To create a user workload report, follow these steps:
- Sign in to your Kissflow account > Analytics > Data explorer.
- Search for ProcessInstance table.
- Open ProcessInstance and click Create report. Alternatively, hover over the card, and click More options button (
 ) > Create report.
- Provide a name and description to the report and select the report type as Tabular.
- Under Columns, add the fields AssignedTo, Flow name, Created by, and Status to show them as table columns.
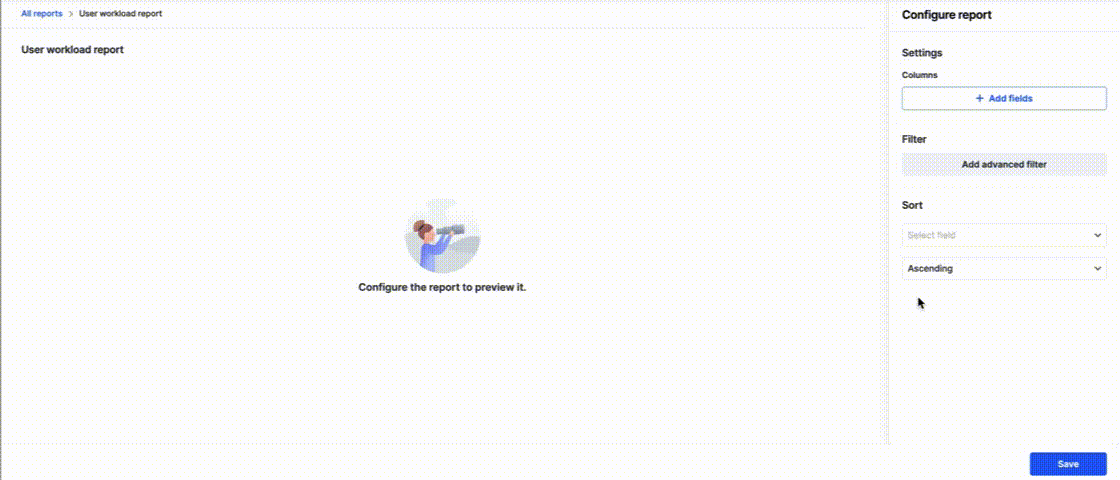
- Click Save.
Using dataview as a data source
- Sign in to your Kissflow account > Analytics > Data explorer > Create dataview.
- Provide a name for the dataview and click Create.
- Enter the SQL query in the query builder and click Run.
- After checking the query result, click Publish to publish the dataview.
- Build a chart or pivot report over the dataview.
Dataview query snippet
Select
"_id" as "ProcessInstanceId",
AssignedTo.value: Name as "AssignedToName",
AssignedTo.value: _id as "AssignedToId",
"_flow_name" as "FlowName",
"AssignedAt.value" as "AssignedAt",
"_status" as "Status",
"_modified_at.value" as "ModifiedAt",
"CurrentActivityInstance" as "CurrentActivityInstance"
from
"ProcessInstance",
Table(Flatten(input => "AssignedTo")) AssignedTo
Dataview query result