
 User guide
Reports in forms

Reports help you derive insights into how your process, board, or data form functions. You can generate customized reports to find trends, patterns, and outliers in your app.
Access reports by clicking the Reports tab on your form page.
Creating a new report inside a form
To create a new report inside a process, board, or data form, click the Reports tab > New report.
- Provide a name for the report.
- Choose the type of report.
- Click Create.
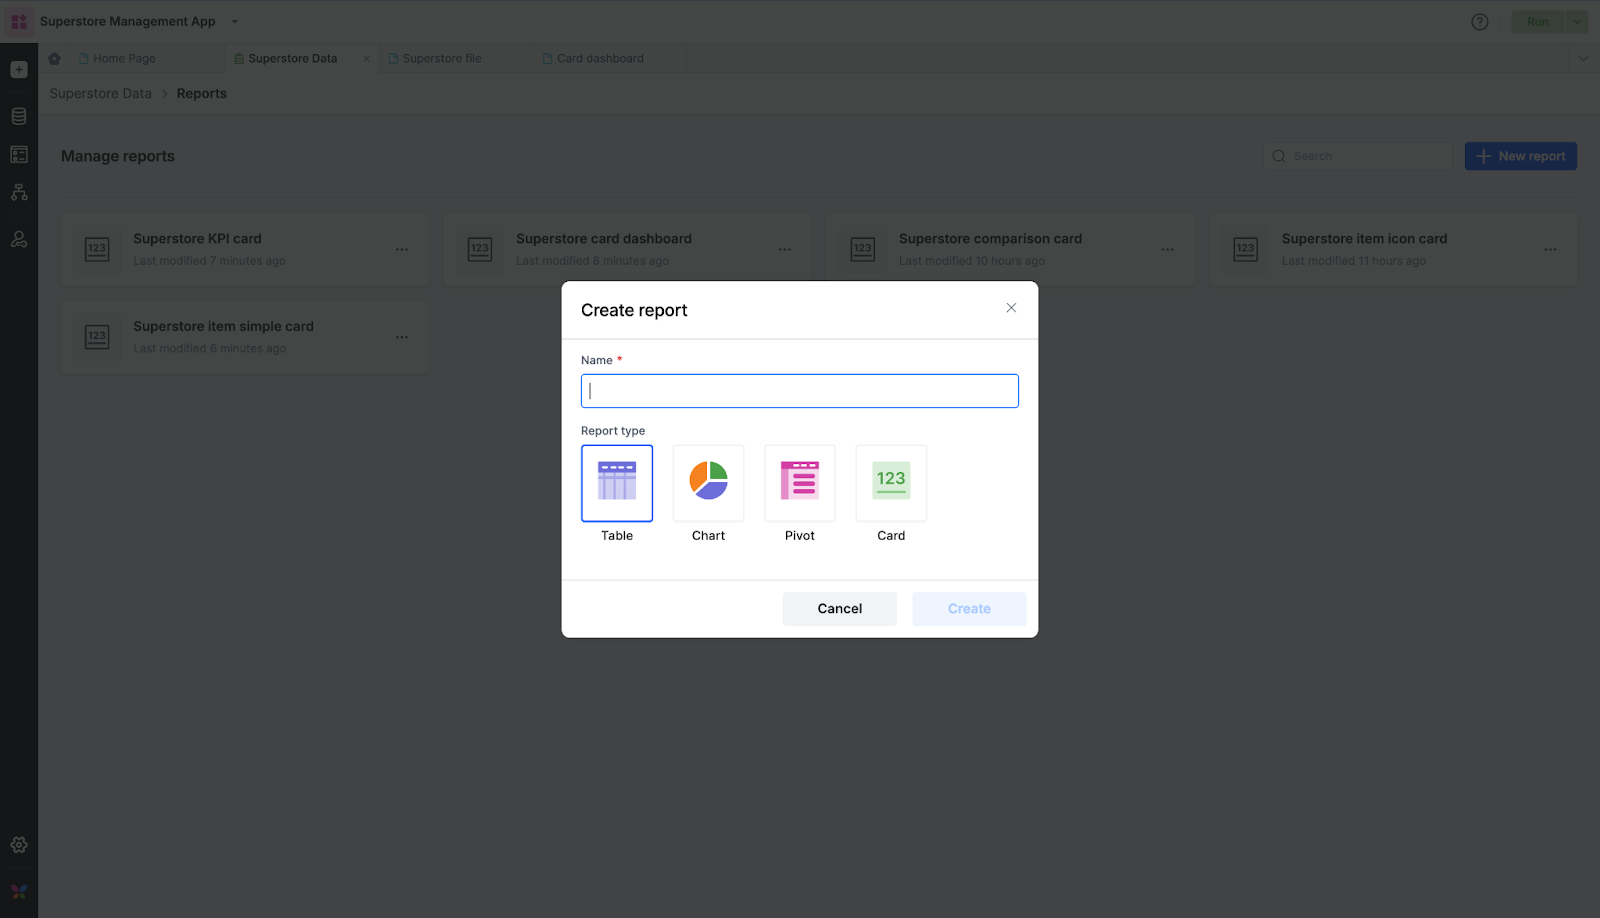
Types of reports
Tabular reports display information in columns and rows, like a spreadsheet.
Charts display data graphically in one of ten chart types including area, bar, doughnut, line, pie, and bubble chart.
Pivot reports can be used to quickly summarize large quantities of data. You can convert columns into rows and rows into columns.
Card reports display key analytics metrics and KPIs, providing a clear view of performance and trends at a glance, using essential data and comparison calculations.
Note:
The reports you create within processes, boards, and data forms provide data specific to each flow. Analytics reports, however, can only be created within the Analytics module of an app