Performance report
Modified 1 year ago
Abhiram
The performance report displays all descriptive statistics pertaining to the distribution of time ranges in the data. This report provides the minimum, maximum, and average time spent by tasks for each step and assignee combination.
Step performance report – This report can be used to isolate steps where tasks take up more time than others and identify performance ranges in your project. You can further break down each step by members of your team.
Assignee performance report – This report can be used to find members who are slowing down the project and identify performance ranges in your project. You can further break down each member based on the steps in which their tasks are located.
Accessing the performance report
Click Reports > Time reports > Step/Assignee performance report from within your project to access this report.
This report is only available to project admins and members with whom the report has been shared.Using the performance report
The performance report shows all the descriptive statistics related to spread of time ranges in the data. These values are represented in a table.
- Minimum time: The least time spent by tasks in a specific step or with a member.
- Maximum time: The maximum time spent by tasks in a specific step or with a member.
- Mean time: The average time spent by tasks in a particular step or with a member. It is calculated by adding up the individual time values and dividing the result by the number of tasks in these steps or with these members. It is also known as the arithmetic mean.
- Median time: This is the preferred one over mean time when you’ve outliers in your data ranges. Just like the mean time, the median also represents the location of a set of numerical data points by means of a single number. Roughly speaking, the median is the value that splits the data points into two halves: the (approximately) 50% largest and 50% lowest data in the collective when arranged in the ascending order.
You can narrow down your available tasks by using basic and advanced filters.
Time period – You can pick a relative or absolute time period for this report.
Relative time period:
- Last 7 days
- Last 14 days (default value)
- Last 30 days
- This quarter
- This year
Absolute time period: Any custom date range restricted to a period of six months.
The report can also be downloaded in PNG formats as needed.
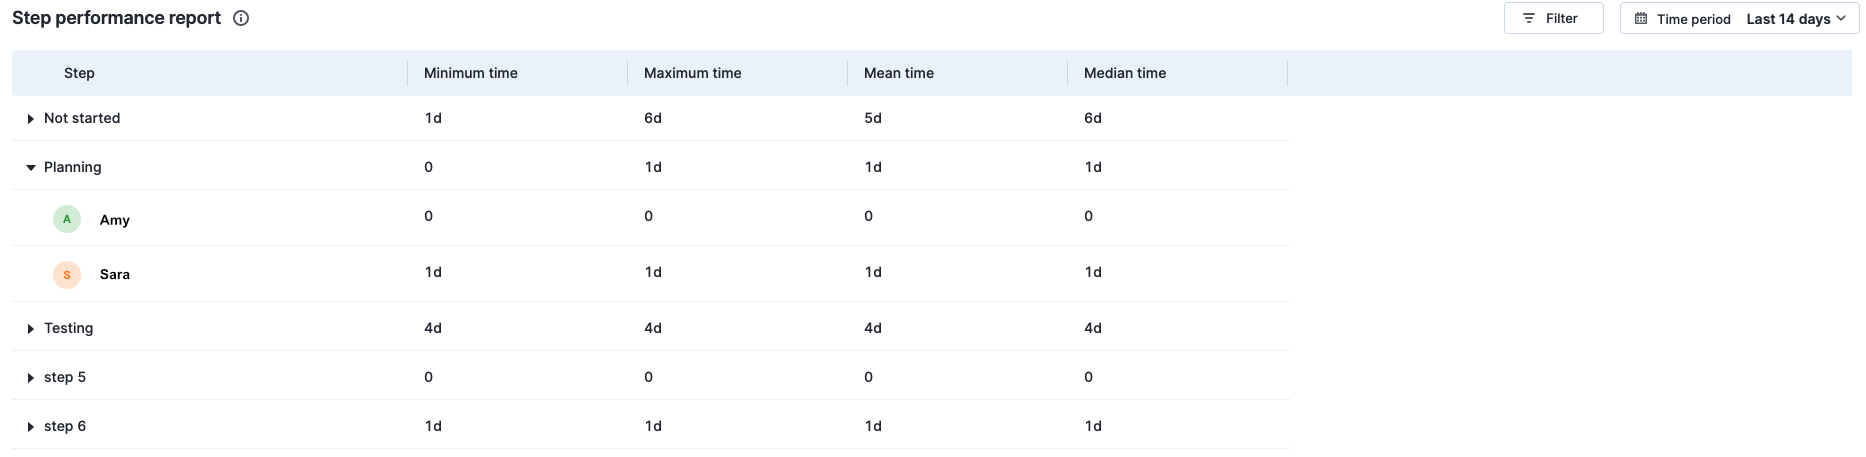
Step performance report
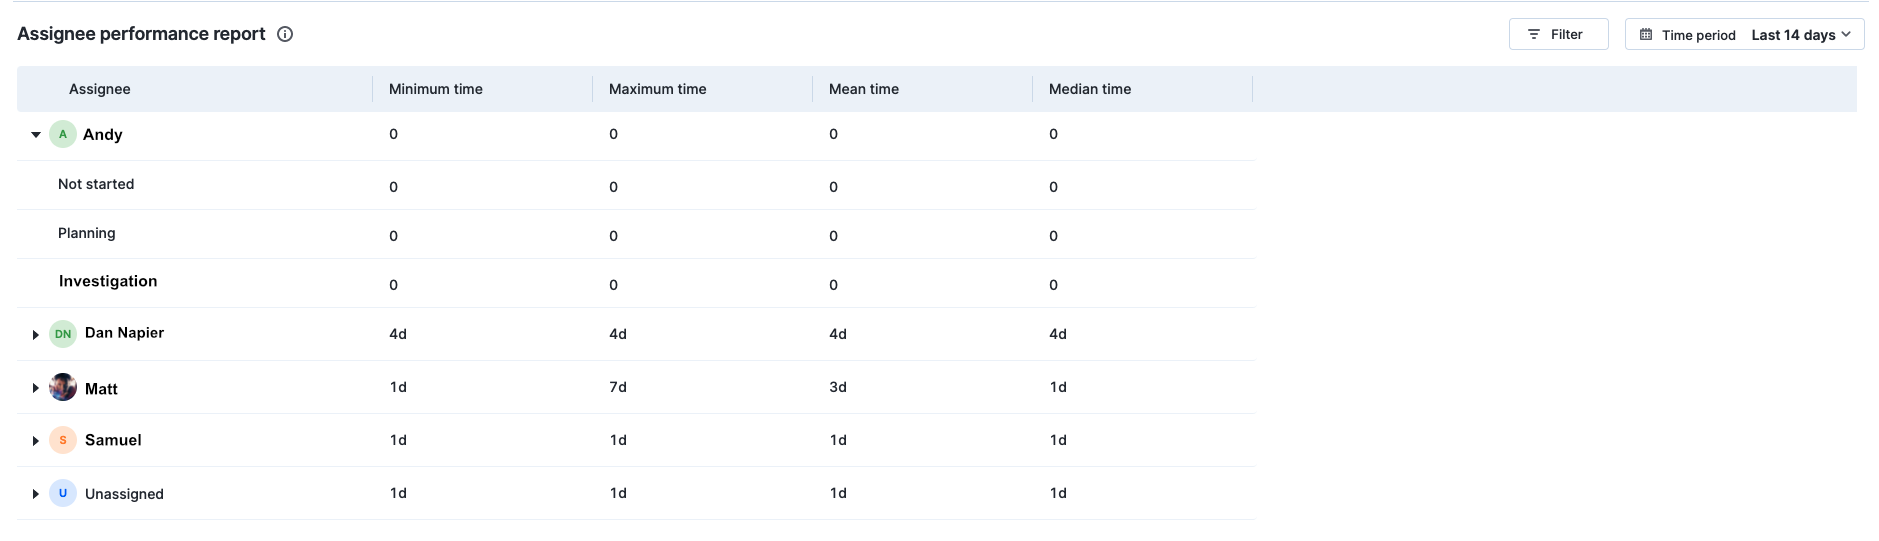
Assignee performance report
Understanding the performance report
Understanding the performance of the project’s steps and assignees is critical for determining what is causing the project to stall and better organizing your project.
Let's look at an example to see how the aging report can be used.
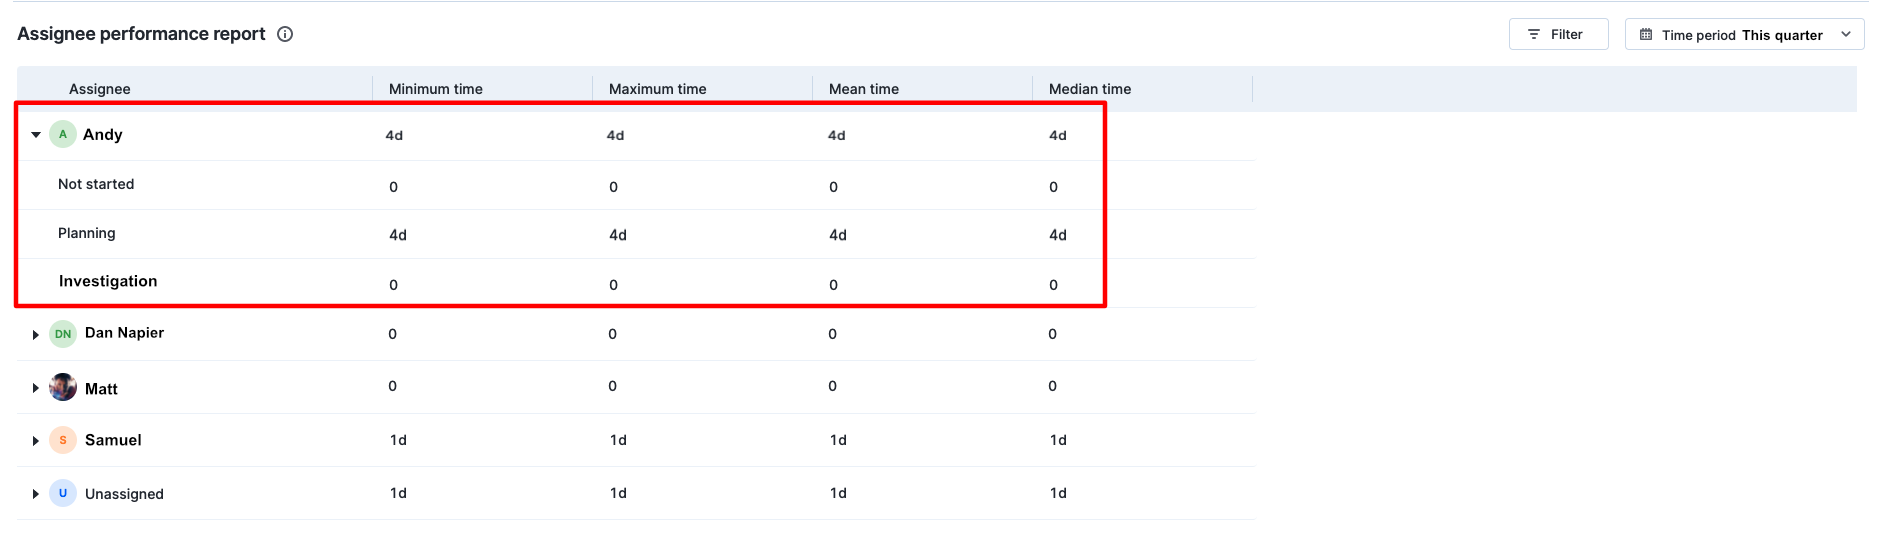
How to evaluate the overall performance ranges of my team members during the past quarter?
Go to Time reports > Assignee performance report, select This quarter as the time period. The report will show the time spent on tasks by various members of your project. You can further view the time taken by tasks across steps in which these members have participated. The mean and median values will provide a clear indication of the members' performance ranges. When there are obvious outliers in your data, choose median over mean.