Step summary report
Modified 1 year ago
Abhiram
The step summary report shows the current task distribution across the steps of your project in a column chart. This report can be accessed in its original form, or you can use filters and breakdowns to get the most up-to-date information on the status of your project. This report only provides a current snapshot of task distribution and does not include any historical data.
Accessing the step summary report
Click Reports > Task reports > Step summary report from within your project to access this report.
This report is only available to project admins and members with whom the report has been shared.
Using the step summary report
X-axis - The steps in a project
Y-axis - The number of tasks
You can narrow down your available tasks by using basic and advanced filters. Also, use the Show/hide steps button to select which steps should be displayed on the report.
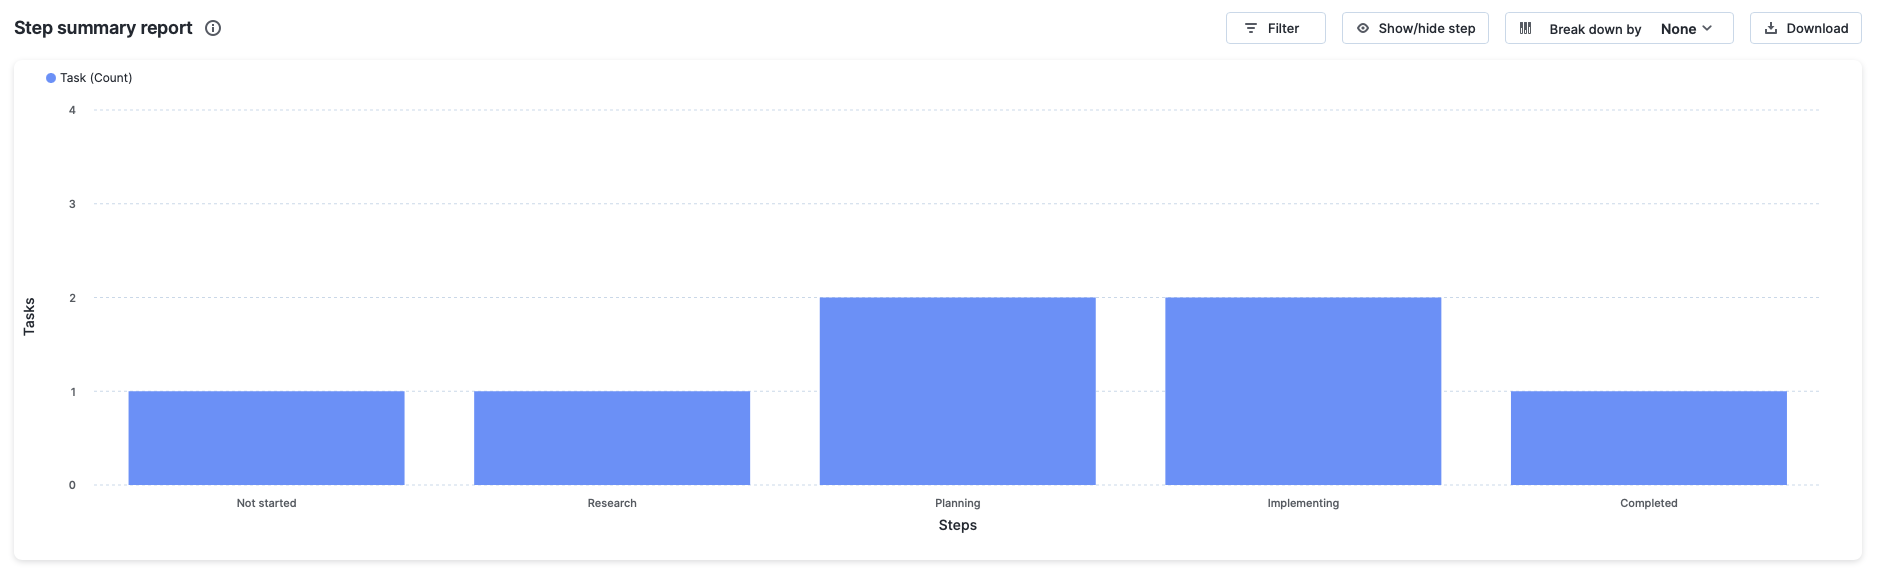
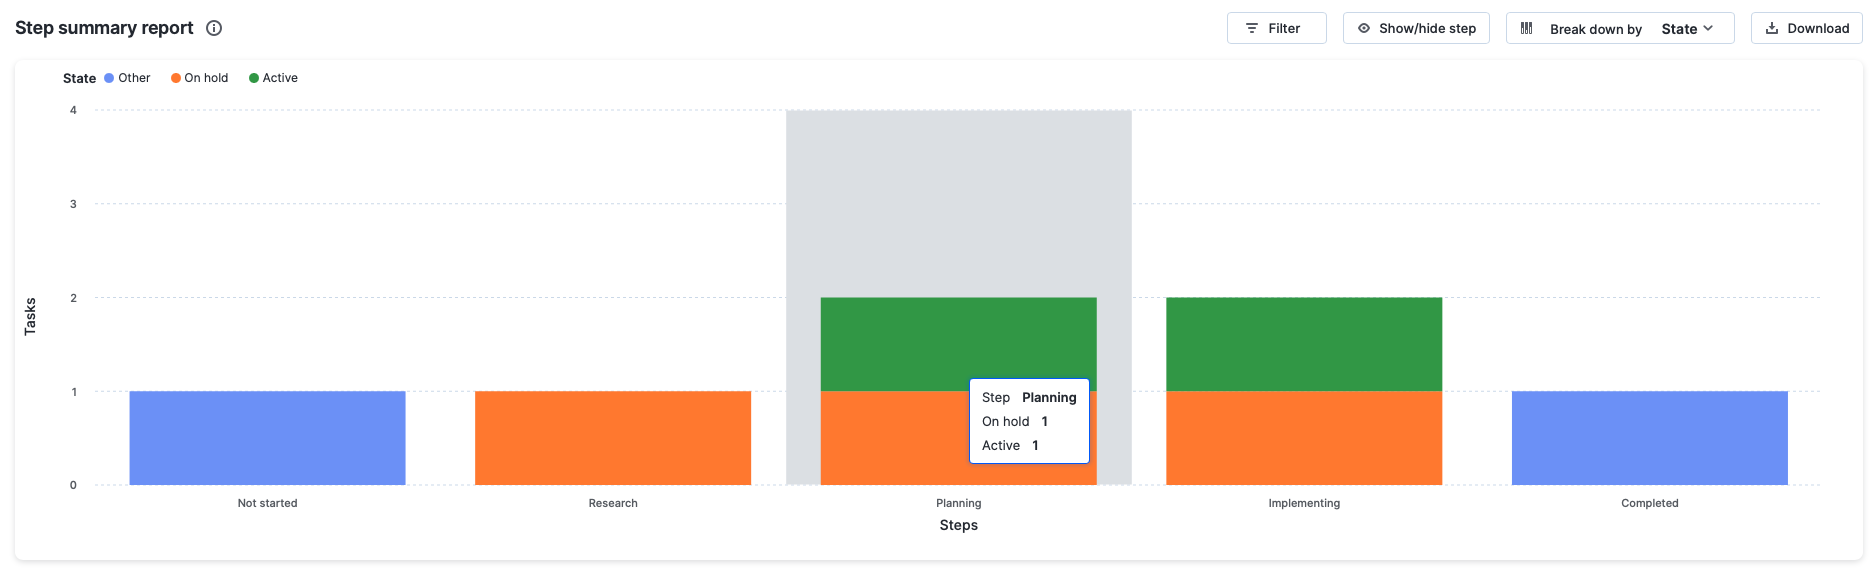
In its original configuration, the step summary report only shows the number of tasks under each step of your project. However, when you decide to break down your steps by state, assignee, or dropdown fields, the report becomes a stacked column chart.
- Steps broken down by state – Tasks in individual steps divided into three states: active, on hold, and done. The column chart depicts the distribution of tasks among these three states.
- Steps broken down by assignee – Tasks in individual steps distributed among the various members of your project.
- Steps broken down by dropdown fields – Tasks in individual steps distributed based on the dropdown fields assigned to them in your project. For example, if the dropdown field is priority and it is defined as low, medium, or high, various tasks in these steps will be segmented based on these priorities.
- Steps broken down by created by and modified by fields - Tasks in individual steps or system steps divided based on creator and modifier of the tasks.
The report can be downloaded in PNG format as needed. Tasks are color coded and identified by legend markers in these columns. When you hover over a column, you'll see the task count associated with your selection.
Understanding the step summary report
Look no further than the step summary report for granular details on your project's task distribution. This means you can apply filters and break down your tasks by assignee, state, or dropdown field to retrieve actionable data from your project.
Let's take a look at an example in which the step summary report can be useful.
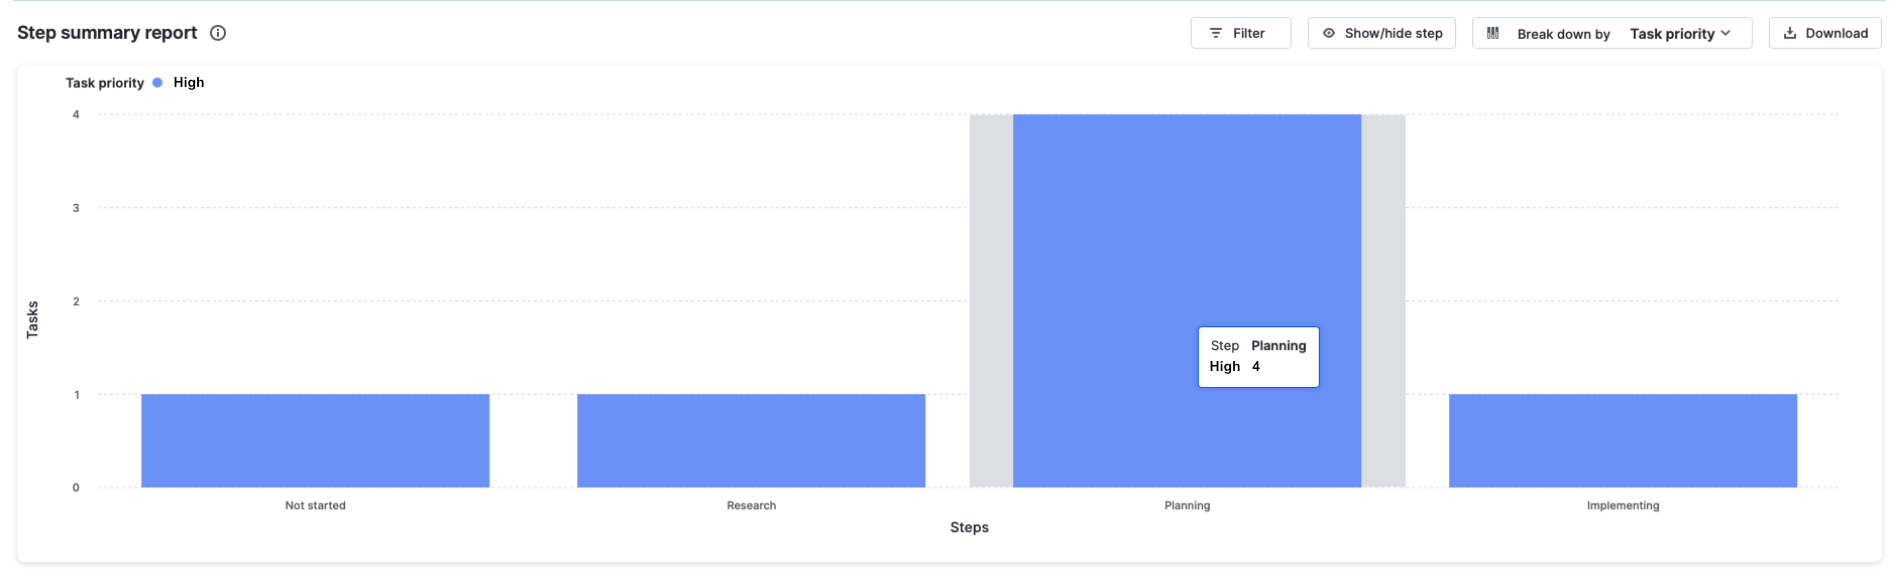
Which step of my project has the most high priority tasks?
To get this data, go to the Step summary report > Breakdown by task priority. In the report, the step with the longest band for high priority tasks is the one you're looking for.