Efficiency report
Modified 1 year ago
Abhiram
The project efficiency report helps measure your project with the time taken by the tasks in progress. Tasks in your In-progress steps are shown on a stacked column chart. A large number of tasks in the On hold or Done states of steps indicate potential bottlenecks in the project. This report indicates project efficiency through adherence to time ranges.
Accessing the efficiency report
Click Reports > Time reports > Efficiency report from within your project to access this report.
This report is only available to project admins and members with whom the report has been shared.
Using the efficiency report
X-axis - The steps in a project
Y-axis - The time spent by tasks (in days)
You can narrow down your available tasks by using basic and advanced filters. Also, use the Show/hide steps button to select which steps should be displayed on the report.
The column chart displays only the tasks in your in-progress steps, with tasks broken down by state.
Time period – You can pick a relative or absolute time period for this report.
Relative time period:
- Last 7 days
- Last 14 days (default value)
- Last 30 days
- This quarter
- This year
Absolute time period: Any custom date range restricted to a period of six months.
The report can be downloaded in PNG format as needed. Tasks in the in progress steps are color coded and identified by legend markers in these columns. When you hover over a column, you'll see the task count associated with your selection.
Understanding the efficiency report
Measuring project efficiency helps you:
- Understand whether your project is improving or not.
- Get insights on steps that you need to focus on to improve your project.
Let's take a look at an example in which the project efficiency report can be used.
Which steps in my project have had low efficiency over the last three months?
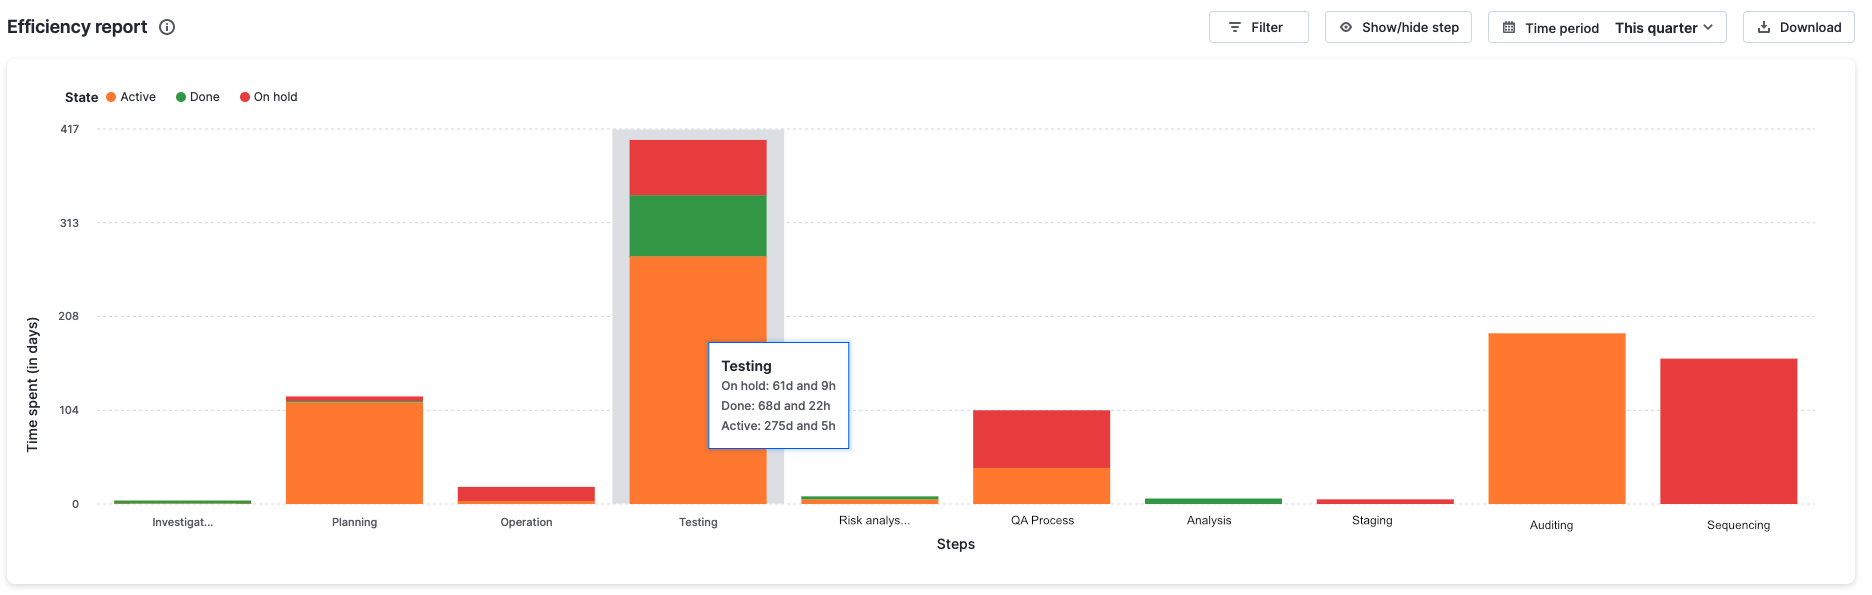
To get this information, navigate to the Efficiency report > choose the time period as This quarter. In the report, the steps with the longest band for On hold and Done states are the ones that are causing delays.
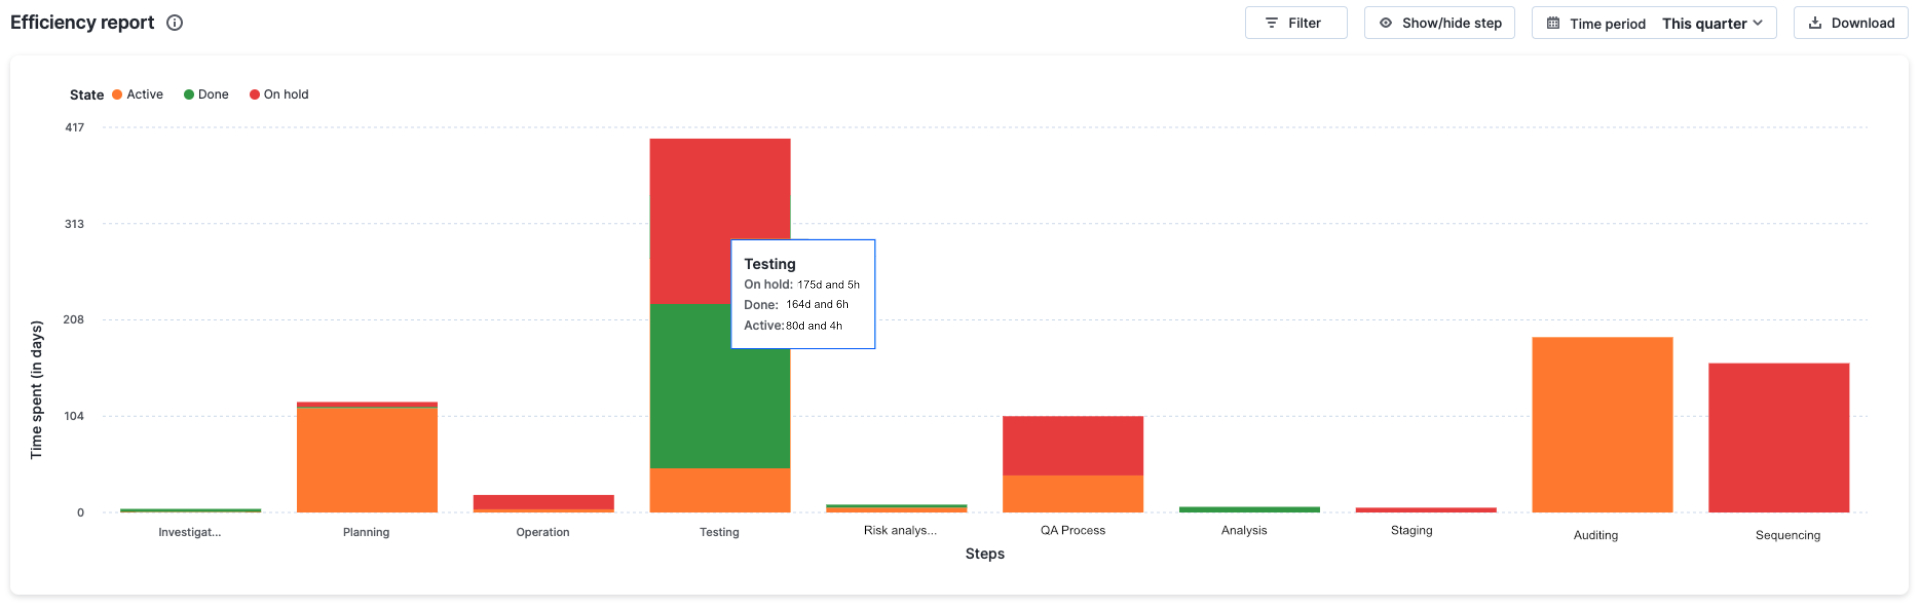
These excessive queue times are most likely due to tasks waiting on something that doesn't depend on the person working on it, or due to a blockage that prevents work from being resumed. The issue might be due to a mismatch in efficiencies between the current and subsequent steps.