Project custom reports
Modified 1 year ago
Abhiram
Reports allow you to gain insight into how your project is progressing. You can create customized reports to analyze trends and various metrics about your project.
Click the Reports button in the left navigation bar of the project page and click Custom reports to create a chart, table, or pivot report of your choice. Reports can only be created by project admins. Members can only see reports that have been shared with them by admins.
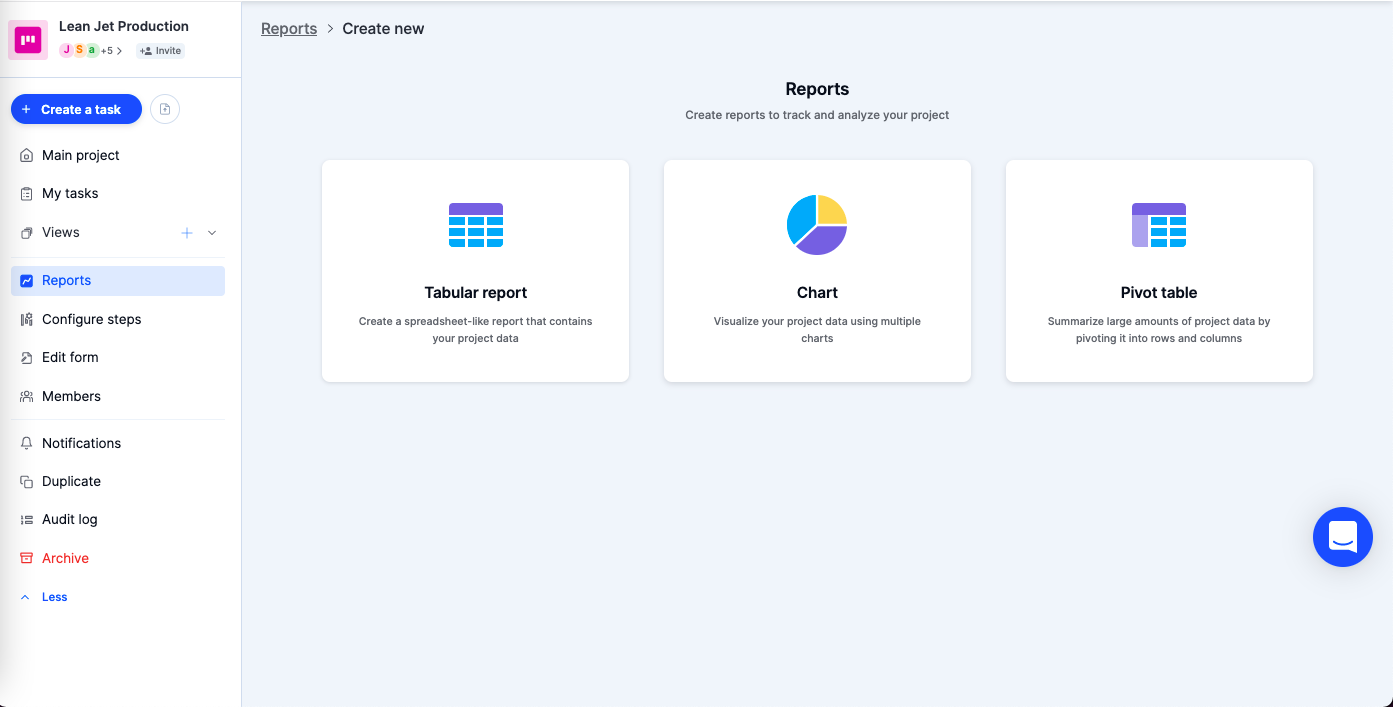
Creating a new custom report
To create a new custom report, click Reports > Create a custom report. Choose the type of report, provide a name for the report, and click Create.
Types of custom reports
- Tabular reports display information in columns and rows, like a spreadsheet.
- Charts display data graphically in one of ten chart types including area, bar, doughnut, line, pie, and bubble chart.
- Pivot tables can be used to quickly summarize large quantities of data. You can convert columns into rows and rows into columns.
Finding other reports
Use the Search box to quickly find any report by name. Type in the name of a report to get relevant results.
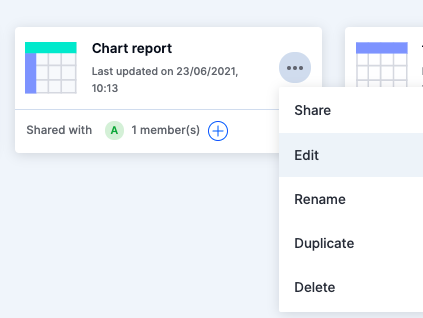
Common actions
Click the More options button ( ) in your report card to:
- Share your report with other members in your project.
- Edit the report
- Rename the report
- Duplicate the report
- Delete the report