Types of visualizations
Modified 1 year ago
Abhiram
In projects, you have the ability to switch your project data between three visualizations:
- Kanban
- List
- Matrix
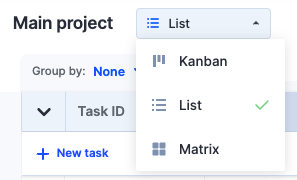
Based on your needs, you can transform your data into another visualization with a single click. Projects let you view your tasks based on steps, assignees, or custom user fields on a Kanban board, filter your tasks on a list, or summarize and analyze your project data using a matrix.
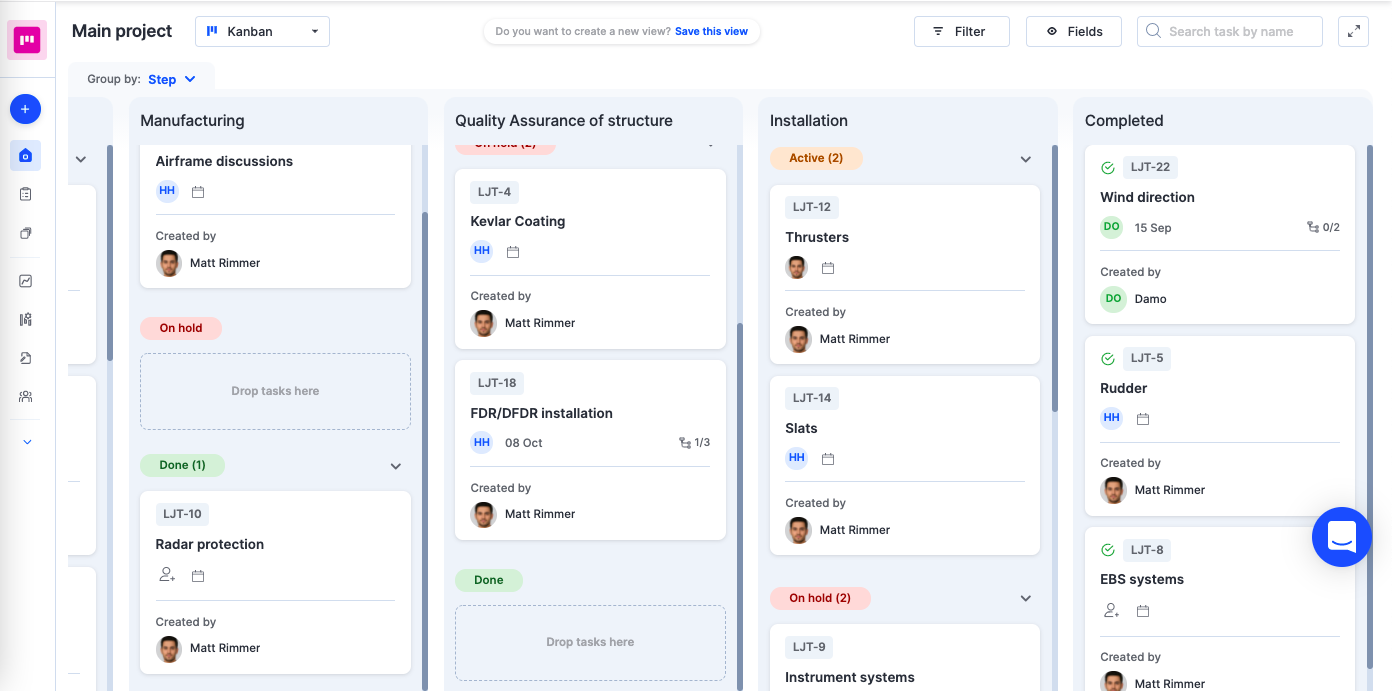
Kanban
This is the default view in Kissflow projects. It is a very flexible, visual, and board-based way to organize your tasks. It is usually the primary view for agile teams, but every user can utilize the convenience offered by Kanban. It lets you manage tasks being worked on side by side in columns and thereby helps visualize progress, as tasks move from one column to another towards completion. You have the flexibility to arrange columns based on steps, assignees, or dropdown user fields. When you do this, tasks will be grouped in different steps based on their default step names, assignee names, or your dropdown values. All uncategorized tasks will be pooled under a column named Uncategorized.
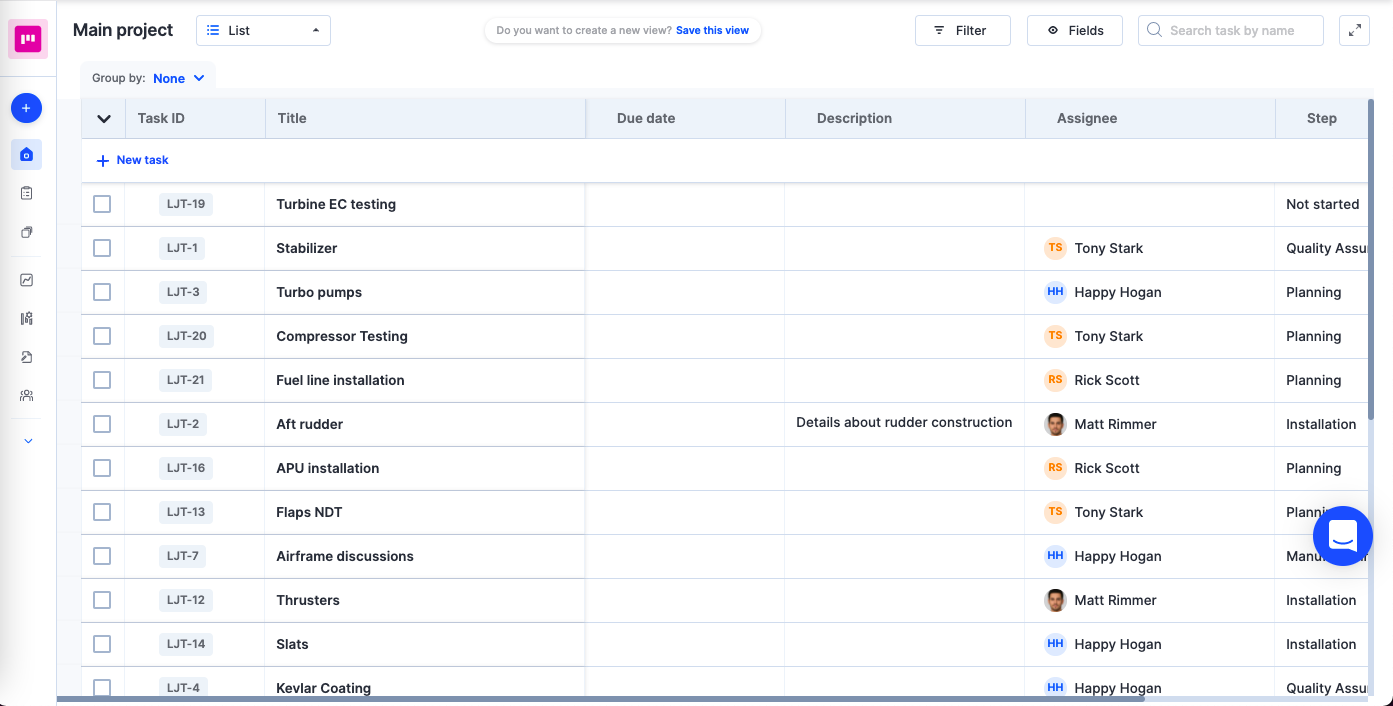
List
If you are in the habit of using spreadsheets to manage your projects, then the List view is meant for you. In this advanced style of visualization, you will see your project tasks in a list.
It offers a flexible view of grouping, sorting, and filtering tasks where tasks are stacked one below the other.
Apart from a default group, you can categorize tasks in your project list by steps, assignees, or custom user fields like dropdowns. It will create horizontal sections under the table heading, within which your tasks will be stacked. You can also reorganize the task list order by using the drag and drop feature.
When you group tasks by assignees, tasks are clubbed under their relevant assignee names. All tasks that are uncategorized will be pooled under the Uncategorized section. List visualization additionally offers the ability to perform bulk actions on your tasks. You can move tasks to a new step/state, update field values, change assignees and due dates, and delete tasks.
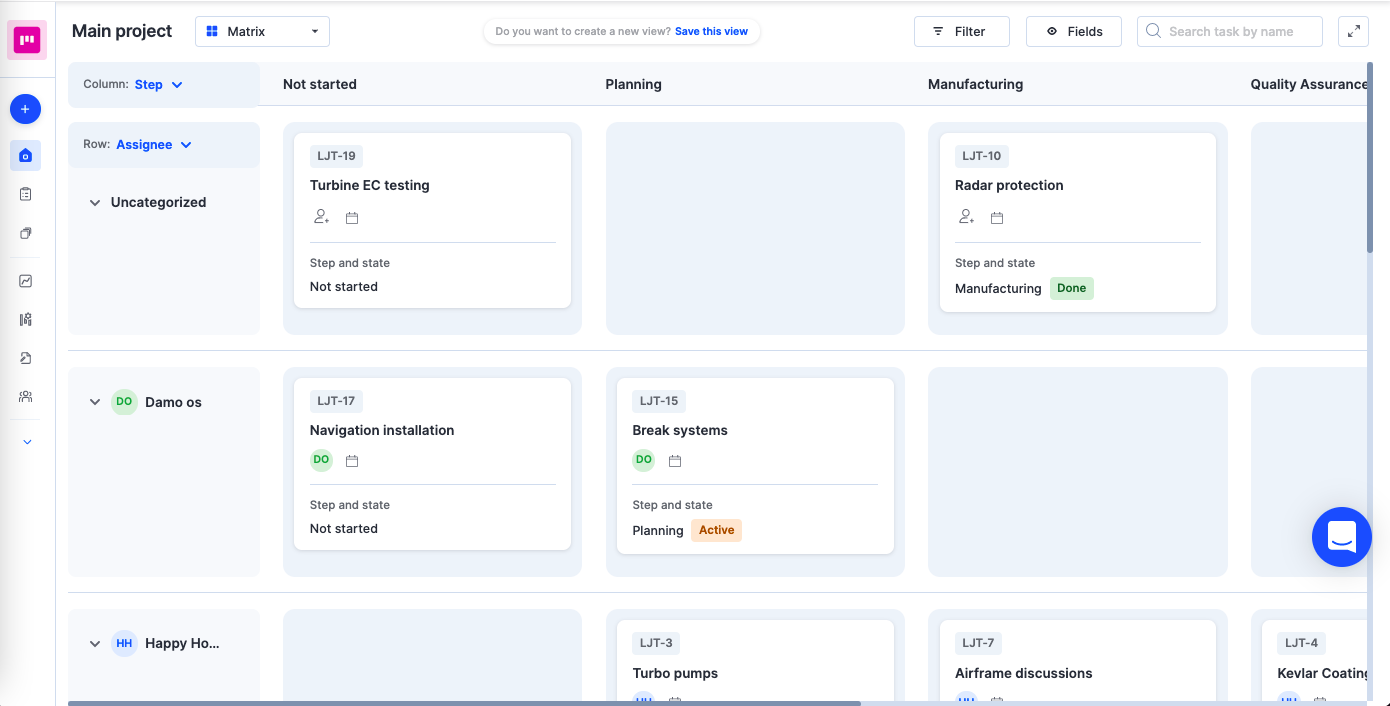
Matrix
Matrix is like Kanban with an additional option of having a secondary categorization through rows. In a matrix view, you can plot your project tasks on a dynamic grid and choose fields for both horizontal and vertical pivots. This task visualization is best suited for performing slice and dice of the project data and for performing resource balancing and reallocation. Similar to Kanban and List, you can choose to group your columns or rows based on assignees, steps, or custom user fields. All uncategorized tasks will be pooled together under a column or row called Uncategorized.