
 User guide
Using reports

Analytics reports feature enable you to create cross-form reports over various data sources, including process tables, child tables, system tables, datasets, and dataviews, and interpret them in a visual or tabular format.
Creating a report from data source
You can use two types of data sources to create reports.
Table: Table holds the actual data that must be evaluated. A table, like a spreadsheet, is made up of columns, the fields in the form, and rows are the items submitted.
Dataview: This is a one-of-a-kind data source created by using columns from one or more tables or dataviews by writing an SQL query in the query editor. Dataviews are unique data sources that combine one or more tables, and you can further simplify the data in the form of a report.
You can create reports based on a data source inside the Data explorer page in two ways.
- Click More options button (
 ) > Create report.

2. Open a data source to Create report.

You can also create a dataview and generate a report. For example, a dataview can combine two different process tables, and then you can create a report over it. Learn how to create a dataview.
Creating a report
To create a new report in analytics:
- Click the Analytics button (
 ).
). - Under the Reports tab, click Create report.
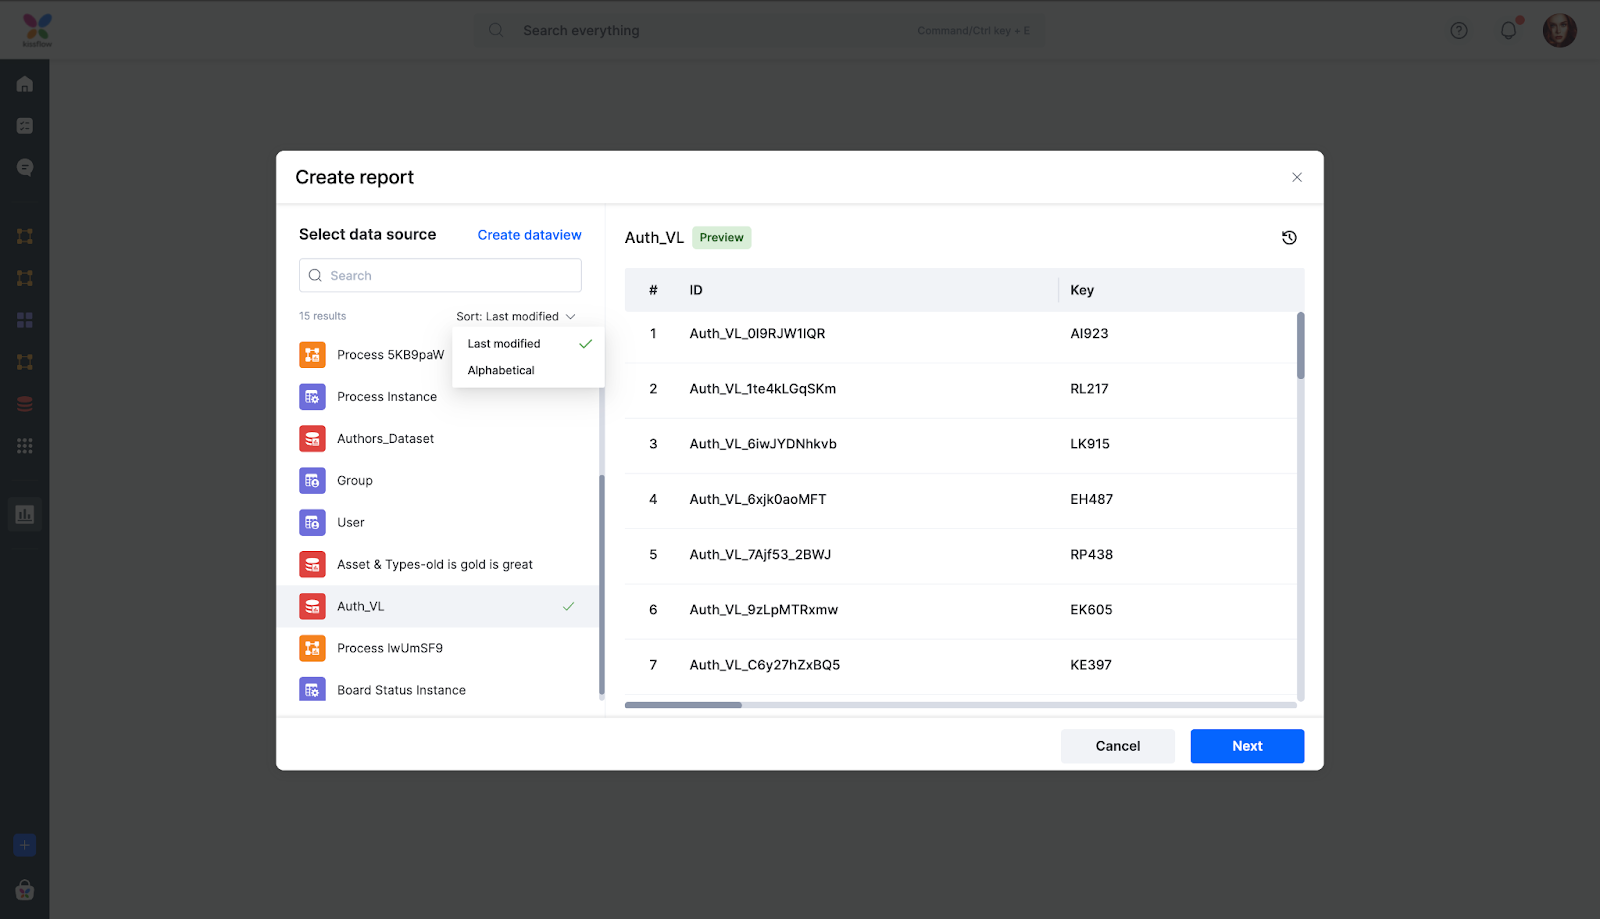
Select the data source. You can also sort the data sources by Last modified or in an Alphabetical order to get a better view.
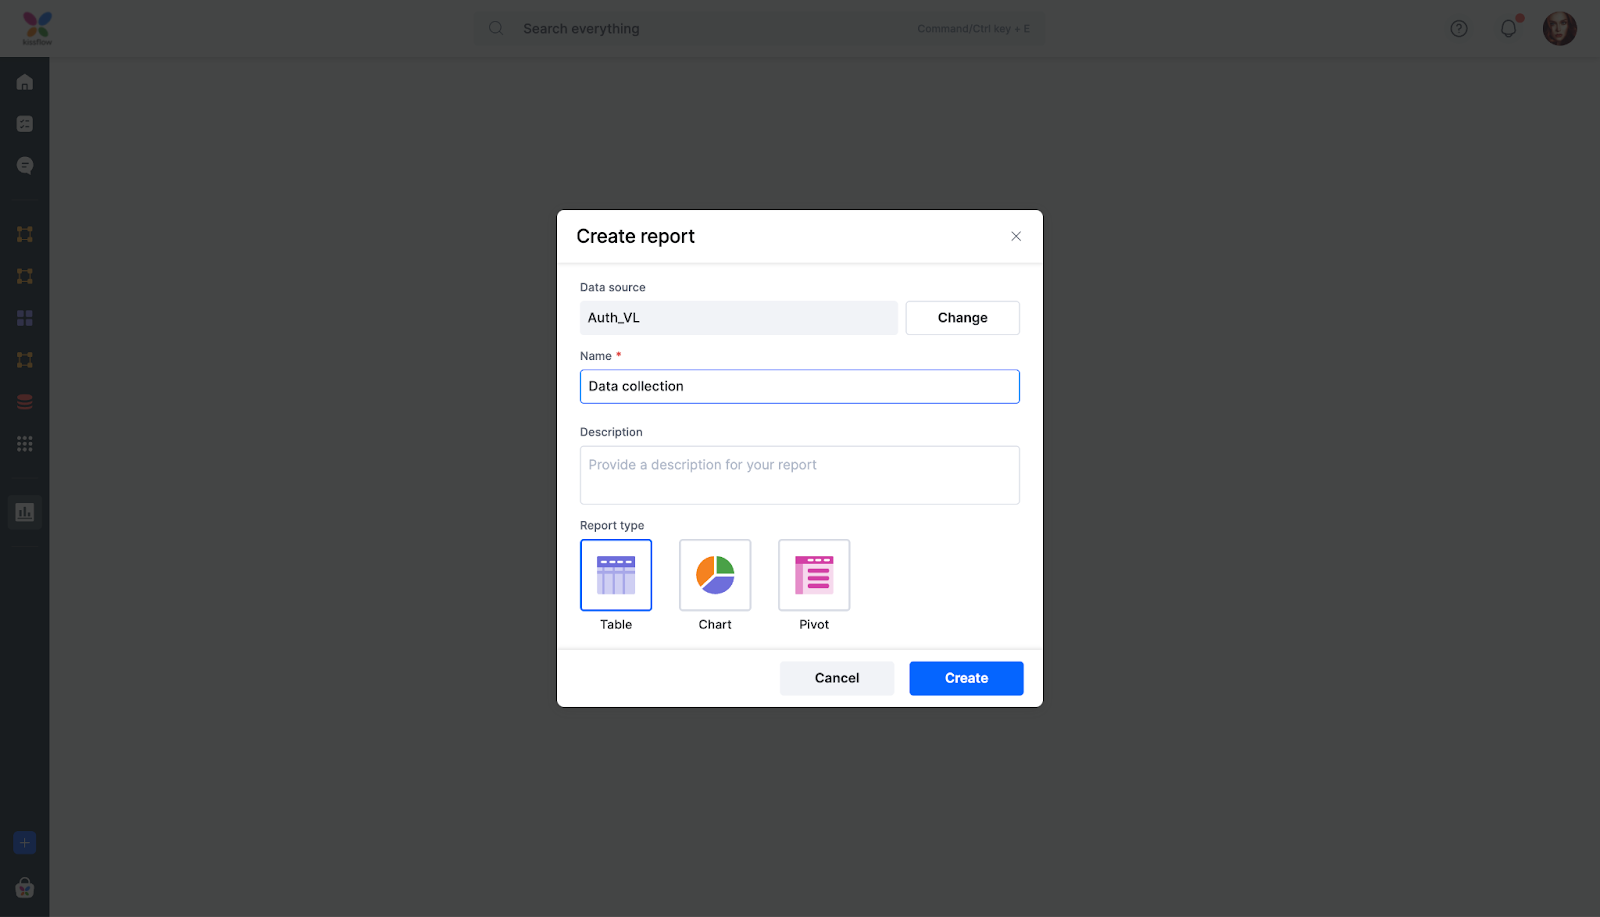
Provide a name and select the Report type.
Click Create.

Applying styles to your report
You can apply styles to your report. In report configuration page, click Style tab beside the Settings tab. The style options vary according to the type of report.
- Tabular reports allow style customization for column headers, rows, and cells.
- Chart reports have 10 color variants for customized chart appearance.
- Pivot tables can be styled for headers, cells, and grand totals.

Additional actions
You can get a live preview of your report without saving it as and when you change the report configuration.

You can also edit, rename, delete, and duplicate a report. To do the following, click the More options button () of the report you want > select one of the following.
- Click Share > Share settings > click Add member > choose the required role - Admin or Member > click Add.
- Click Edit > Configure report page > Select the fields of the data source using the settings such as dimension, measure and legend > Click Save.
- Rename a report by clicking Rename > provide the new name > click Rename.
- Click the Delete option > Delete.
- Select the Duplicate option > provide the required name for the copy of your report > Click Duplicate. A copy of the selected report, including the share permissions and the customizations, will be created in the Reports page.

Note:
You cannot change the data source and report type when editing an existing report. You can only change the chart type and other properties.